Blogs
Discover a boundless realm of knowledge and personal growth, all conclaiently accessible right at your fingertips.

Designing dashboards in Power BI
Designing wireframes for your first dashboard sounds daunting, and often our clients feel intimidated by this process. In the below guide, we aim to tackle some of the barriers in terms of product knowledge and understanding some of the basics when designing a dashboard. Below are the 5 things you need to know to create an effective dashboard
Jackie Tejwani
Apr 22, 2025

Field Parameters in Power BI: A Comprehensive Guide
Power BI May 2022 update saw the introduction of Field parameters which was added into preview. This feature allowed users to dynamically swap measures and dimensions without the use of complex DAX, manual tables or bookmarks.
Saurav Sathawane
Feb 10, 2025

Personalization in Power BI Service
Personalize visuals is a great way to enhance your reports users' experience in Power BI.
Jackie Tejwani
Dec 16, 2024
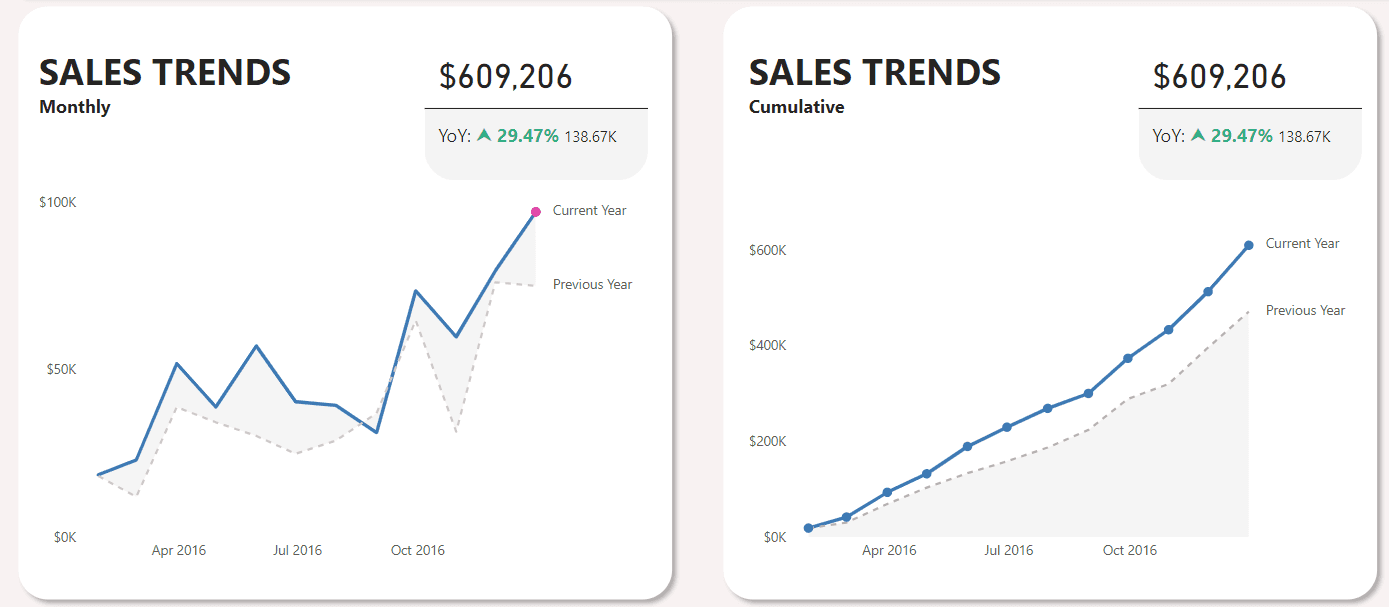
Year on Year (YoY) comparisons in Power BI
Time trends are among the most common ways to provide insights in almost every industry. Applicable in every dataset from Sales, Impressions, Website visits, etc, they are great at generating insights around: Average baseline, Linear or Exponential, Seasonality, Growth
Jackie Tejwani
Oct 7, 2024

Data Modelling in Power BI
Data modelling is the make-or-break stage for any Power BI Report. A well-built data model ensures your report refreshes fast and scales with compounding data.
Jackie Tejwani
Sep 15, 2024

Ethics in Data Science: What Every Business Leader Should Know
Learn the key ethical issues in data science and how business leaders can navigate them responsibly.
Saartje Ly
Sep 6, 2024

How to Clean Your Business Data for Better Insights
Learn how to clean and maintain your business data for accurate analysis and better decision-making.
Saartje Ly
Sep 3, 2024

KPIs and Metrics That Matter: Measuring Success with Data
Learn how to measure business success by tracking key KPIs and metrics that truly matter.
Saartje Ly
Sep 2, 2024

How Data Segmentation Can Drive Targeted Marketing
Learn how data segmentation can help you understand your customers and create targeted marketing campaigns.
Saartje Ly
Sep 2, 2024

5 Common Data Science Myths Busted for Business Leaders
Debunk five common myths about data science and discover how it can benefit your business.
Saartje Ly
Sep 2, 2024

A/B Testing in Power BI
A/B testing is a popular statistical technique used to understand whether a change to method actually performs better. It is commonly used in website design, marketing campaigns, and health care.
Jackie Tejwani
Aug 26, 2024

Azure Interview Questions
Get fully prepared for your next Azure interview with these essential questions covering key services, architecture, and best practices.
Saartje Ly
Aug 21, 2024

Creating an Azure Storage Account
Learn how to create and configure an Azure Storage account, covering redundancy options, advanced settings, networking, and encryption.
Saartje Ly
Aug 21, 2024

Introduction to Cloud
Discover the benefits and key characteristics of cloud computing, including its service models, deployment options, and global reach.
Saartje Ly
Aug 20, 2024

Making Data-Driven Decisions: A Guide for Business Leaders
Learn how business leaders can make smarter, data-driven decisions to drive growth and innovation.
Saartje Ly
Aug 19, 2024

Data Science for Small Businesses: Simple Steps to Get Started
Unlock the power of data science for your small business with simple, actionable steps.
Saartje Ly
Aug 19, 2024

8 Python Libraries You Must Know for Data Science
Learn about key Python libraries crucial for data analysis, visualization, machine learning, and web scraping.
Saartje Ly
Aug 14, 2024

Advanced SQL
Master advanced SQL techniques like EXISTS, CASE, and RECURSIVE with practical examples using Customers and Orders tables.
Saartje Ly
Aug 13, 2024

Intermediate SQL
Master intermediate SQL with techniques on filtering, joins, subqueries, aggregations, and more. Enhance your data querying skills!
Saartje Ly
Aug 7, 2024

An Introduction to SQL
Discover SQL basics: manage, query, and manipulate relational databases efficiently. Learn essential commands and operations for effective data handling.
Saartje Ly
Aug 6, 2024

A Comprehensive Guide to Understanding DAX in Power BI
Explore DAX in Power BI with this guide on key functions, contexts, and practical applications for data analysis.
Saartje Ly
Jul 29, 2024

From Concatenation to Data Blending and Optimization in Tableau
Learn how to concatenate fields, format sales data, blend multiple data sources, and optimize visualizations in Tableau.
Saartje Ly
Jul 29, 2024

Pivot data using Power Query in Power BI
Learn how to transform and pivot data in Power BI for simplified analysis and improved data structure.
Saartje Ly
Jul 29, 2024

How to use Power BI DAX
This blog guides you through solving common Power BI questions with DAX, covering calculations, totals, and logical functions.
Saartje Ly
Jul 23, 2024

Learn DAX fundamentals in Power BI
Learn to solve common questions using DAX in Power BI, from calculating total revenue to categorizing columns.
Saartje Ly
Jul 23, 2024

How to create a word cloud in Tableau
Learn how to effectively use text fields for size, color, and text to create a word cloud in Tableau.
Saartje Ly
Jul 17, 2024

How to use Joins in Tableau
Learn how to perform joins in Tableau to combine data from multiple sources, enhancing your visualizations with richer information.
Saartje Ly
Jul 17, 2024

Tableau Dashboard tips
Learn to create and format interactive Tableau dashboards, adding features for effective data visualization and enhanced user experience.
Saartje Ly
Jul 17, 2024

Create a vertical bar chart in Tableau
Get started with Tableau by importing Titanic data from Kaggle, visualizing age distributions, and adding labels for better insights.
Saartje Ly
Jul 17, 2024

10 Tableau tricks you should know
Discover 10 essential Tableau tips and shortcuts to streamline your workflow and enhance your data visualization process.
Saartje Ly
Jul 16, 2024

What is data science and why it matters for a business
Discover how data scientists analyze and transform data to extract knowledge, drive decisions, and gain competitive advantages.
Saartje Ly
Jul 9, 2024

Making data work for you in Tableau
Learn how to clean and merge messy datasets in Tableau by interpreting Excel files, handling incomplete values, and using grouping and aliases for effective visualization.
Saartje Ly
Jul 9, 2024

Tableau: adding value to analysis - trends, distributions, and forecasting
Learn how to create trend lines, distribution bands, and five-year sales forecasts using Tableau's Sample Superstore Workbook.
Saartje Ly
Jul 9, 2024

Telling a data story with dashboards in Tableau
Create engaging Tableau dashboards, blending data and customizing filters, to transform raw data into compelling visual stories.
Saartje Ly
Jul 1, 2024

Tableau: Formatting a visualization
Learn to format Tableau visualizations by customizing fonts, colors, filters, and themes using the Sample Superstore workbook for enhanced appearance and functionality.
Saartje Ly
Jul 1, 2024

Tableau: Table Calculations
Explore quick table calculations in Tableau: direction, differences, pane calculations, dimensions, and secondary calculations using Sample Superstore.
Saartje Ly
Jul 1, 2024

Tableau: Using row-level and aggregate calculations
Learn about Tableau's three levels of calculations, parameters, dynamic axes, KPIs, and ad hoc calculations using the Sample Superstore workbook.
Saartje Ly
Jun 27, 2024

Tableau: From foundational to advanced visualizations
Learn about dimensions, measures, and how discrete vs continuous fields impact visualizations using Tableau's Sample Superstore Workbook.
Saartje Ly
Jun 27, 2024

Working with data in tableau
Master Tableau techniques for working with extracted and live data, filtering, joins, and blends to enhance performance and real-time insights for strategic planning.
Saartje Ly
Jun 2, 2024

Tableau Fundamentals
Discover how to use Tableau for creating interactive dashboards, connecting to data sources, and visualizing data through user-friendly steps and features.
Saartje Ly
Jun 1, 2024

Microsoft Azure Overview: Creating Service Principals
Learn Azure RBAC to manage access, define permissions, and create role assignments for fine-grained Azure resource management.
Saartje Ly
May 26, 2024

Azure SQL Databases: Introduction
Discover Azure SQL, a family of SQL cloud databases that offer flexible options for application migration, modernization, and development, providing a consistent and unified experience.
Saartje Ly
May 25, 2024

Microsoft Azure Overview: Authentication, Authorization, Applications & Security Principals.
Explore managing Azure resources using Azure Active Directory for secure authentication and controlled application access.
Saartje Ly
May 25, 2024

How to read data from an API in Power BI
Learn how to load API data into Power BI by using the Web data source to connect to public or private APIs for real-time data integration.
Saartje Ly
May 25, 2024

Creating a Resource in Microsoft Azure
Follow these steps to create a SQL database in Azure, configuring project details, networking, security, and additional settings for a customized setup.
Saartje Ly
May 19, 2024

A Microsoft Azure Introduction and how to create an Azure Account
Learn the basics of Azure, Microsoft's cloud computing platform, and explore the benefits of cloud computing and how to create and manage resources efficiently.
Saartje Ly
May 19, 2024

Working with M (Power Query) in Power BI
Discover how to use M language in Power Query to transform and combine data creatively in Power BI.
Saartje Ly
May 18, 2024

Notifications in your Power BI report
Implement a notification bell in Power BI to keep users updated with key messages and information directly within the report.
Saartje Ly
May 12, 2024

5 design tricks for Power BI dashboards
Enhance your Power BI dashboard's visual appeal with alignment, white space, rounded corners, shadows, and custom backgrounds from PowerPoint.
Saartje Ly
May 11, 2024

How to sort by month in Power BI
Learn how to sort months correctly in Power BI by creating a Month Number column and using it to sort your visualizations accurately.
Saartje Ly
May 5, 2024

4 useful Power BI visualizations that Excel doesn't offer
Learn how to enhance your Power BI reports with advanced visuals like ribbon charts, decomposition trees, scatter charts, and infographics.
Saartje ly
May 5, 2024

Power BI Slicers
Learn how to effectively use various slicers in Power BI to enhance your data filtering, visualization capabilities, and overall data analysis.
Saartje Ly
May 4, 2024

10 Power BI tips for better dashboards
Explore these 10 Power BI tips to enhance your reports with advanced features like conditional formatting, custom images, tooltips, and more.
Saartje Ly
Apr 28, 2024

Perform Advanced Analytics in Power BI
Unlock advanced analytics in Power BI with techniques like grouping, binning, drill down/up, and AI visuals for deeper insights.
Saartje Ly
Apr 27, 2024
Create a basic Power BI dashboard
Learn how to create text banners and add visualizations to your Power BI report for a polished, professional look.
Saartje Ly
Apr 21, 2024

Accessibility in Power BI
Explore Power BI's accessibility features, including built-in options like keyboard navigation and high contrast view, and configurable options such as alt text and tab order.
Saartje Ly
Apr 21, 2024

Report features in Power BI
Learn how to create and format visualizations in Power BI, including adding slicers, drill-through pages, and conditional formatting for dynamic, interactive reports.
Saartje Ly
Apr 21, 2024

Optimizing model performance in Power BI
Learn the steps and best practices to optimize a data model for enterprise-level performance using DirectQuery, variables in DAX, and other optimization techniques.
Saartje Ly
Apr 16, 2024

Model calculations using DAX in Power BI
DAX in Power BI uses functions and operators to create calculated tables, columns, and measures for dynamic data analysis.
Saartje Ly
Apr 16, 2024

Design a Data model in Power BI
Learn data modeling to design efficient databases, ensure data integrity, and optimize performance for storage, retrieval, and analysis.
Saartje Ly
Apr 12, 2024

Merging tables in Power BI
Learn how to merge tables in Power BI using various joins to combine data based on specified relationships or matching criteria.
Saartje Ly
Apr 12, 2024

Cleaning data in Power BI with Power Query Editor
Learn how to clean and transform data in Power BI using the Power Query Editor with essential tasks like promoting headers and replacing values.
Saartje Ly
Apr 8, 2024

Pandas library for Data Science
Explore the pandas library for Python, a powerful tool for data manipulation and analysis with high-level data structures and functions.
Saartje Ly
Apr 3, 2024

Creating a basic Azure Function App and Azure Function
Learn how to create a basic Function App in Microsoft Azure Portal and build a Python function using VS Code.
Saartje Ly
Apr 3, 2024

An introduction to Power BI
Discover how Power BI transforms data into interactive reports and dashboards, providing insightful business intelligence and enhancing data-driven decision-making.
Saartje Ly
Apr 3, 2024

An introduction to Azure Functions
Learn about Azure Functions, Microsoft's serverless computing service for building scalable, event-driven applications effortlessly.
Saartje Ly
Apr 2, 2024