CONTENT
Optimizing model performance in Power BI
Learn the steps and best practices to optimize a data model for enterprise-level performance using DirectQuery, variables in DAX, and other optimization techniques.


Saartje Ly
Data Engineering Intern
April 16, 2024
Introduction
This article will introduce you to steps, processes, concepts, and data modeling best practices necessary to optimize a data model for enterprise-level performance.
Optimize DirectQuery models
When data is loaded into Power BI, it typically involves importing all data from the source, potentially leading to a large file size and performance issues. Refreshing data in Power BI Desktop means reloading all data into the data model, which can be time-consuming and may need to be done multiple times daily.
To overcome these challenges, especially when dealing with large or frequently changing data requiring up-to-date reports without increasing file sizes, consider using DirectQuery. With DirectQuery, Power BI connects directly to the original data source without importing data into Power BI. When creating visualizations, queries are sent to the data source to retrieve necessary data. Upon refresh, these queries are re-executed to update each visual. When reports are published to the service, you'll see a dataset alongside the reports, but the dataset itself contains no actual data.
How to use DirectQuery
1. Firstly, we need to publish our report online. In the Home tab click the Publish button
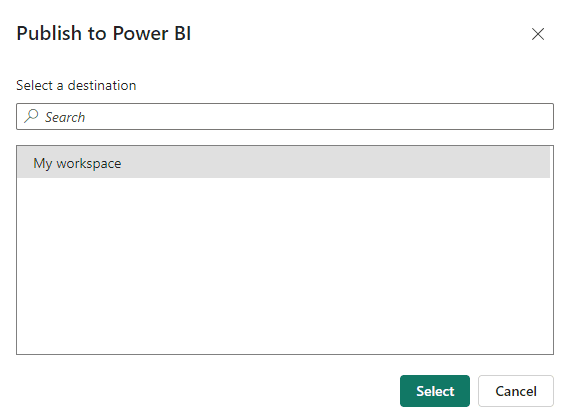
2. Choose your desired workspace and hit Select

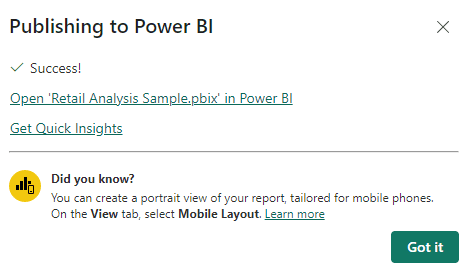
3. You may view this data in the cloud by clicking the link under the ‘Success!’ text

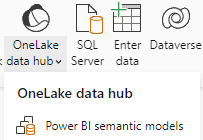
4. Next, in the Home tab click the dropdown for OneLake data hub, and select Power BI semantic models

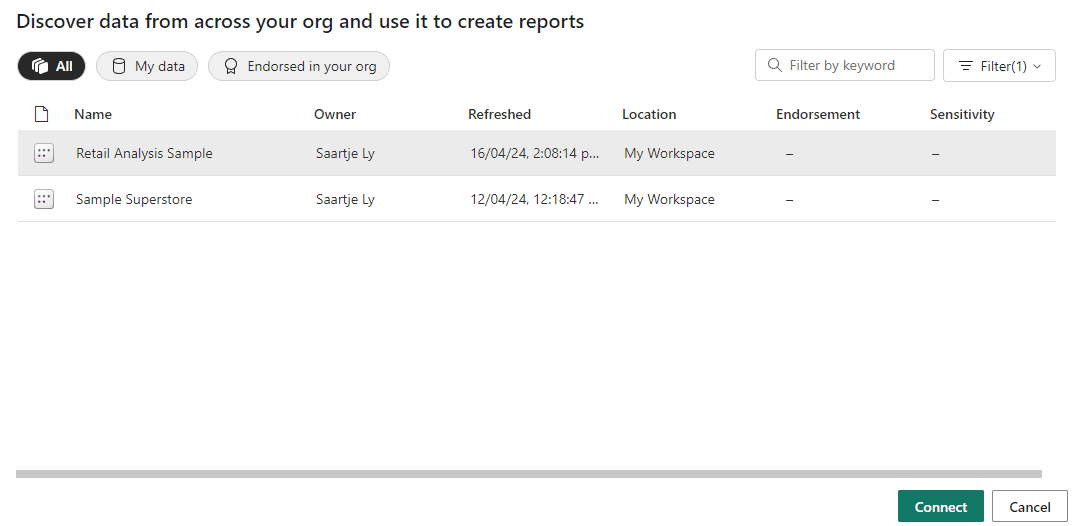
Here, you should see your datasets published to the service.
5. Select your desired dataset, and click Connect

What are variables?
For data modelers, crafting and troubleshooting certain DAX calculations can present significant challenges. Complex calculation needs often require crafting compound or intricate expressions. These expressions usually involve multiple nested functions and may require reusing logic. Incorporating variables into your DAX formulas is instrumental in developing sophisticated and effective calculations.
By using variables, you can assign a name to the result of an expression, which can then be used as an argument in other measure expressions and reused as needed. Once a variable expression has been evaluated and its value determined, that value remains constant even if the variable is referenced in subsequent expressions. This approach streamlines the creation and maintenance of complex DAX calculations.
Variables:
Improve performance
Improve readability
Simplify debugging
Reduce complexity
Using variables in measures
1. Right click on your desired table and choose new Measure
2. Rename the measure, then define a variable inside this measure using VAR followed by the variable name and what it is

Here we are returning Total sales, filtered by Corporate Customer Segment and the year 2010.
The variables CorporateSales and IncludedDates are only available in the measure 2010 Total Corporate Sales.
Other optimization techniques
Optimizing Power BI reports
Apply the most restrictive filters (i.e., instead of having one visualization trying to show everything, break it down by filtering)
Limit visuals on report pages
Evaluate how well your custom visualizations are performing
Optimizing the environment
Capacity settings
Gateway sizing
Network latency
Introduction
This article will introduce you to steps, processes, concepts, and data modeling best practices necessary to optimize a data model for enterprise-level performance.
Optimize DirectQuery models
When data is loaded into Power BI, it typically involves importing all data from the source, potentially leading to a large file size and performance issues. Refreshing data in Power BI Desktop means reloading all data into the data model, which can be time-consuming and may need to be done multiple times daily.
To overcome these challenges, especially when dealing with large or frequently changing data requiring up-to-date reports without increasing file sizes, consider using DirectQuery. With DirectQuery, Power BI connects directly to the original data source without importing data into Power BI. When creating visualizations, queries are sent to the data source to retrieve necessary data. Upon refresh, these queries are re-executed to update each visual. When reports are published to the service, you'll see a dataset alongside the reports, but the dataset itself contains no actual data.
How to use DirectQuery
1. Firstly, we need to publish our report online. In the Home tab click the Publish button
2. Choose your desired workspace and hit Select

3. You may view this data in the cloud by clicking the link under the ‘Success!’ text

4. Next, in the Home tab click the dropdown for OneLake data hub, and select Power BI semantic models

Here, you should see your datasets published to the service.
5. Select your desired dataset, and click Connect

What are variables?
For data modelers, crafting and troubleshooting certain DAX calculations can present significant challenges. Complex calculation needs often require crafting compound or intricate expressions. These expressions usually involve multiple nested functions and may require reusing logic. Incorporating variables into your DAX formulas is instrumental in developing sophisticated and effective calculations.
By using variables, you can assign a name to the result of an expression, which can then be used as an argument in other measure expressions and reused as needed. Once a variable expression has been evaluated and its value determined, that value remains constant even if the variable is referenced in subsequent expressions. This approach streamlines the creation and maintenance of complex DAX calculations.
Variables:
Improve performance
Improve readability
Simplify debugging
Reduce complexity
Using variables in measures
1. Right click on your desired table and choose new Measure
2. Rename the measure, then define a variable inside this measure using VAR followed by the variable name and what it is

Here we are returning Total sales, filtered by Corporate Customer Segment and the year 2010.
The variables CorporateSales and IncludedDates are only available in the measure 2010 Total Corporate Sales.
Other optimization techniques
Optimizing Power BI reports
Apply the most restrictive filters (i.e., instead of having one visualization trying to show everything, break it down by filtering)
Limit visuals on report pages
Evaluate how well your custom visualizations are performing
Optimizing the environment
Capacity settings
Gateway sizing
Network latency
Introduction
This article will introduce you to steps, processes, concepts, and data modeling best practices necessary to optimize a data model for enterprise-level performance.
Optimize DirectQuery models
When data is loaded into Power BI, it typically involves importing all data from the source, potentially leading to a large file size and performance issues. Refreshing data in Power BI Desktop means reloading all data into the data model, which can be time-consuming and may need to be done multiple times daily.
To overcome these challenges, especially when dealing with large or frequently changing data requiring up-to-date reports without increasing file sizes, consider using DirectQuery. With DirectQuery, Power BI connects directly to the original data source without importing data into Power BI. When creating visualizations, queries are sent to the data source to retrieve necessary data. Upon refresh, these queries are re-executed to update each visual. When reports are published to the service, you'll see a dataset alongside the reports, but the dataset itself contains no actual data.
How to use DirectQuery
1. Firstly, we need to publish our report online. In the Home tab click the Publish button
2. Choose your desired workspace and hit Select

3. You may view this data in the cloud by clicking the link under the ‘Success!’ text

4. Next, in the Home tab click the dropdown for OneLake data hub, and select Power BI semantic models

Here, you should see your datasets published to the service.
5. Select your desired dataset, and click Connect

What are variables?
For data modelers, crafting and troubleshooting certain DAX calculations can present significant challenges. Complex calculation needs often require crafting compound or intricate expressions. These expressions usually involve multiple nested functions and may require reusing logic. Incorporating variables into your DAX formulas is instrumental in developing sophisticated and effective calculations.
By using variables, you can assign a name to the result of an expression, which can then be used as an argument in other measure expressions and reused as needed. Once a variable expression has been evaluated and its value determined, that value remains constant even if the variable is referenced in subsequent expressions. This approach streamlines the creation and maintenance of complex DAX calculations.
Variables:
Improve performance
Improve readability
Simplify debugging
Reduce complexity
Using variables in measures
1. Right click on your desired table and choose new Measure
2. Rename the measure, then define a variable inside this measure using VAR followed by the variable name and what it is

Here we are returning Total sales, filtered by Corporate Customer Segment and the year 2010.
The variables CorporateSales and IncludedDates are only available in the measure 2010 Total Corporate Sales.
Other optimization techniques
Optimizing Power BI reports
Apply the most restrictive filters (i.e., instead of having one visualization trying to show everything, break it down by filtering)
Limit visuals on report pages
Evaluate how well your custom visualizations are performing
Optimizing the environment
Capacity settings
Gateway sizing
Network latency
CONTENT
SHARE