CONTENT
Tableau: Using row-level and aggregate calculations
Learn about Tableau's three levels of calculations, parameters, dynamic axes, KPIs, and ad hoc calculations using the Sample Superstore workbook.


Saartje Ly
Data Engineering Intern
June 27, 2024
Make sure you are in the Sample Superstore workbook to start off.
Three levels of calculation
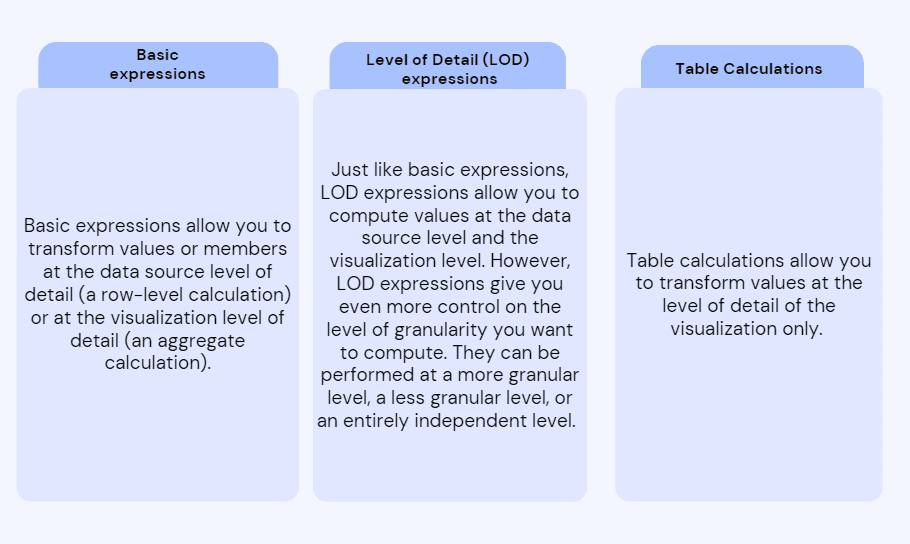
Tableau has three levels of calculation.
We will create a row level calculation to get started.
Create a new worksheet, drag Order Date and Sales to the Column shelf, then drag Ship mode to the Rows shelf.

Now, we will create a row calculation that will display the first word in the name of the Ship mode. I.e., First, Same, Second, and Standard.
Double click on Ship mode in the Rows shelf, then before the square brackets type 'SPLIT('
Then add a comma, open double quote, space, close double quote. This represents a space for the delimiter argument of SPLIT. We are saying that in the ship mode field, a space is what separates the first word from the second word.
Then we will do another comma, and type 1. 1 signifies the first block of text before the space.
Lastly add the closing parathesis and press enter.

Now we will create our aggregate basic calculation.
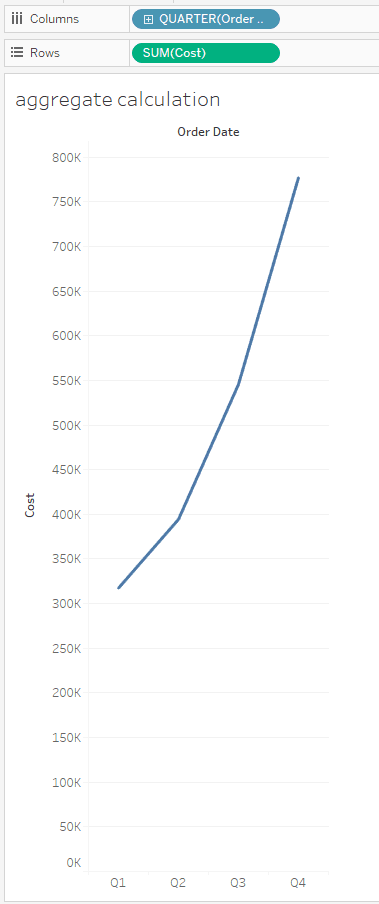
Create a new sheet and drag Order Date onto the Columns shelf. Using the Order Date dropdown, change it from Year to the first Quarter option.
Now, double click on the Rows shelf and type '[Sales]-[Profit]'
Click and drag SUM([Sales]-[Profit]) onto the Fields list
Once it's a part of the Fields list, right click and rename it 'Cost'.
We now want to convert the x axis from discrete to continuous. Notice in the Columns shelf that Order Date is blue. This represents discrete. Right click on it, and choose continuous.
Let's give this visualization more detail by adding another dimension and another measure to it.
Drag the Profit measure and Segment to the Rows shelf. What you'll see here is each Segment with its Cost and Profit.
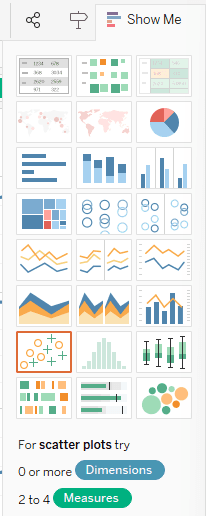
Next, open the Show Me box in the top right hand corner. We want to select the Dual Lines chart.
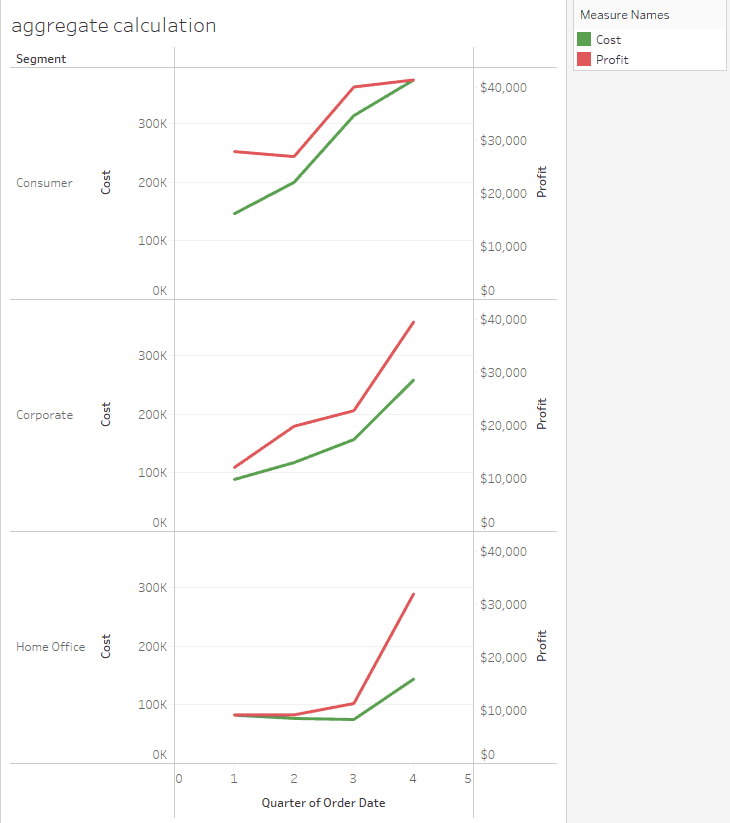
Let's say we wanted to change the colours of the lines. Hover over the Measure Names legend, click the drop down, and click Edit Colours.
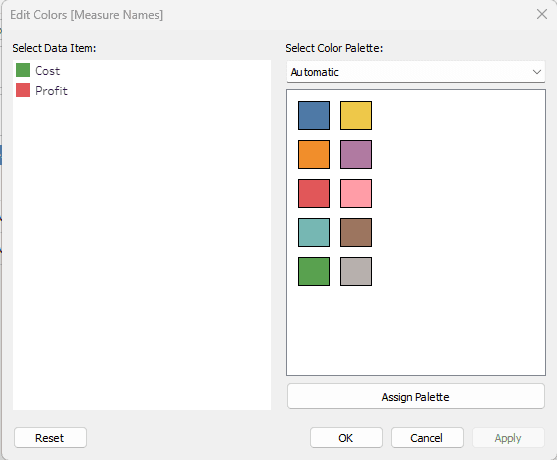
Click on Cost, then assign it a colour. Repeat for Profit.
We now want to add more granularity. Right click on the Order Date box in Columns, and change it to the second Month option. We are choosing this as it displays the month and the year.
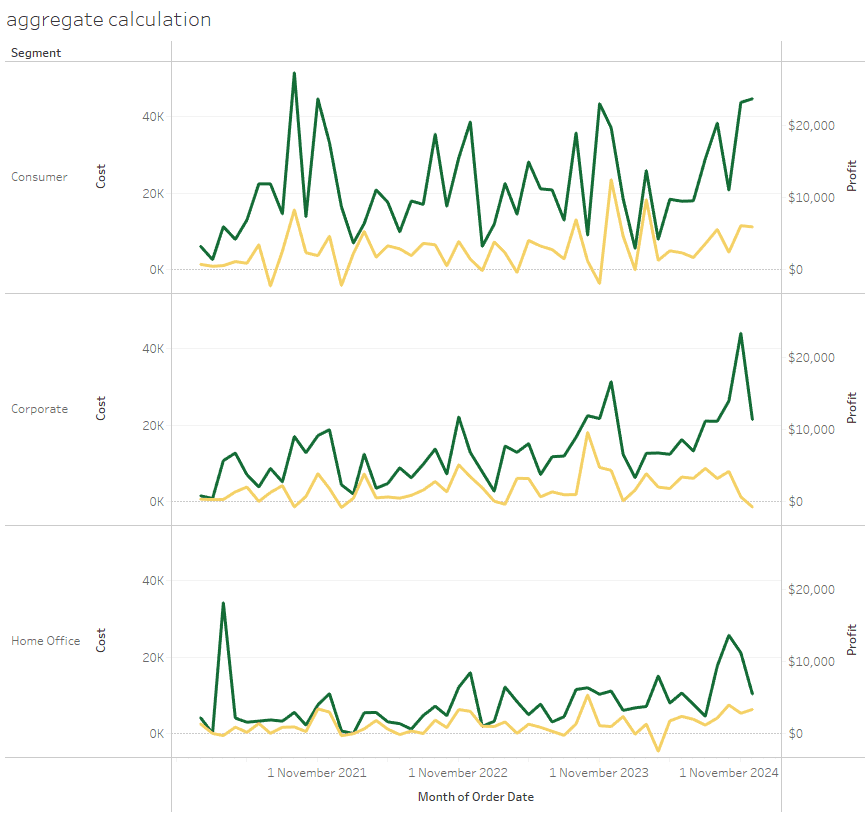
We will now add a filter for interactivity. Right click on Order Date again, and choose Show Filter.
Now we want to change the background colour of our visualization. Right click on the plot, and choose Format. Under the Format Font pane to the left select the bucket icon and notice the worksheet default is white. Change your background colour there.
Creating parameters and calculated fields
It is time to create parameters.
In this lesson we will create two parameters, and two calculated fields. Make sure to close the Format Filter pane. In the Data pane you'll see icons next to the search bar. Click the dropdown arrow and select Create Parameter.
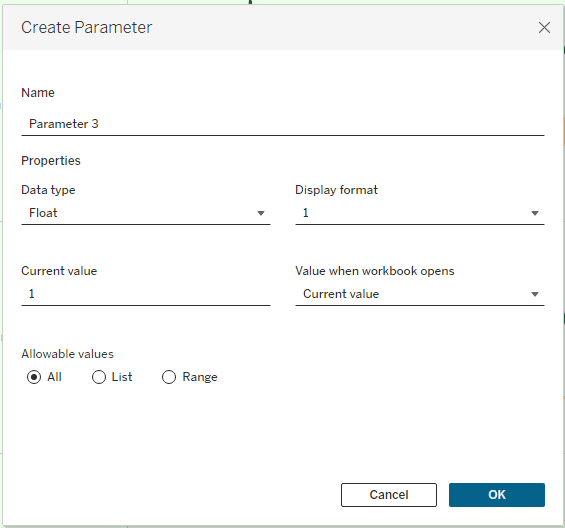
Name this parameter 'Choice 1 Selector', under Properties for the Data type change from Float to String, and under Allowable values change the option button to List.
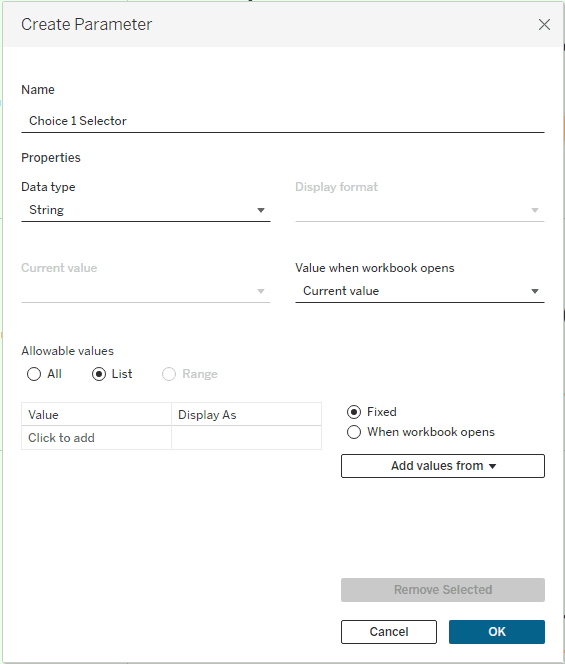
Click where it says Click to add and type 'Discount'. Add another and type 'Profit'. Click to add again and type 'Quantity'. Finally click to add one more time and type 'Sales'. Click OK.
Notice in the Parameters section you'll see your new parameter. Now we want to duplicate it. Right click on your parameter, and choose duplicate. We will have 'Choice 1 Selector (copy)', right click on this, and choose Edit.
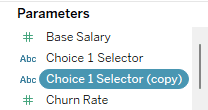
Rename to 'Choice 2 Selector', then click OK.
Now to create the first of our two calculated fields.
Head to the dropdown arrow at the top of the Data pane again, and select Create Calculated Field.

Rename to 'Placeholder 1', and type in the calculation below.
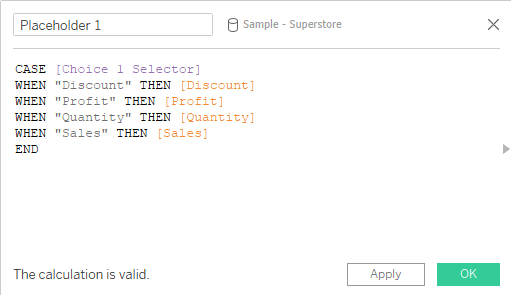
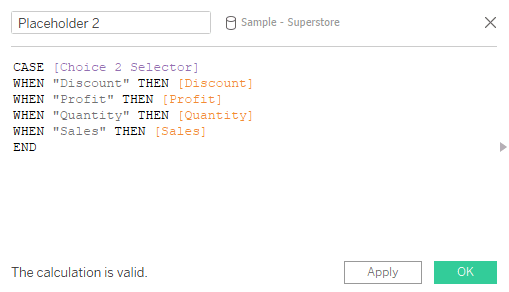
A CASE statement is very similar to the IF THEN ELSE IF ELSE construct. What this is saying is, when Discount is selected in the Choice 1 Selector parameter, then display the Discount field. So on and so forth. Click OK.
You should now see your new field in the Orders Table. Right click on it, and duplicate. Right click on its copy, and Edit.
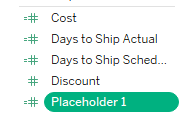
Change the name to Placeholder 2, and change the CASE statement to [Choice 2 Selector]. Click OK.
Now is the time to pull it all together. Go ahead and create a new sheet.
Drag Placeholder 2 to Columns, and Placeholder 1 to Rows.
Drag Customer name to the Detail box in the Marks card, then drag Region to the colour box in the Marks card.
In the Data pane, we're going to right click on each of our created parameters and select Show Parameter.
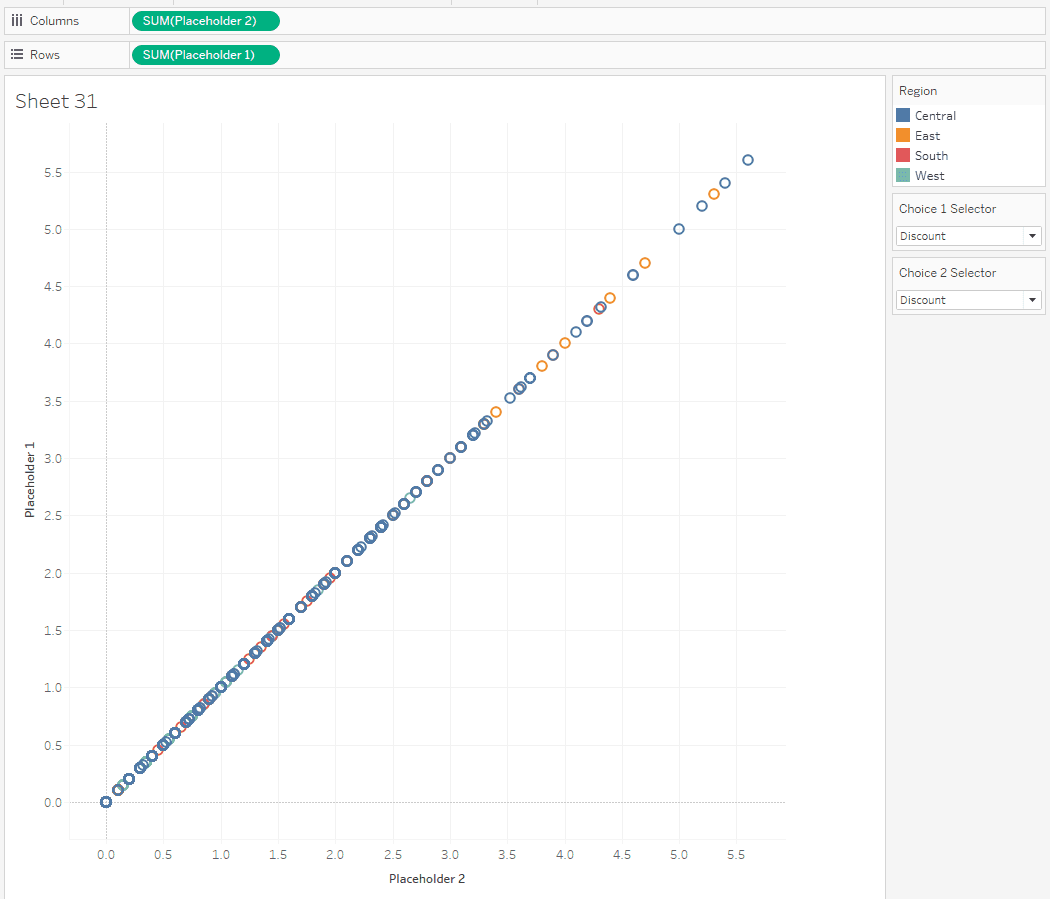
Right now, both parameters are on Discount. Go to Choice 2 Selector and choose Sales.
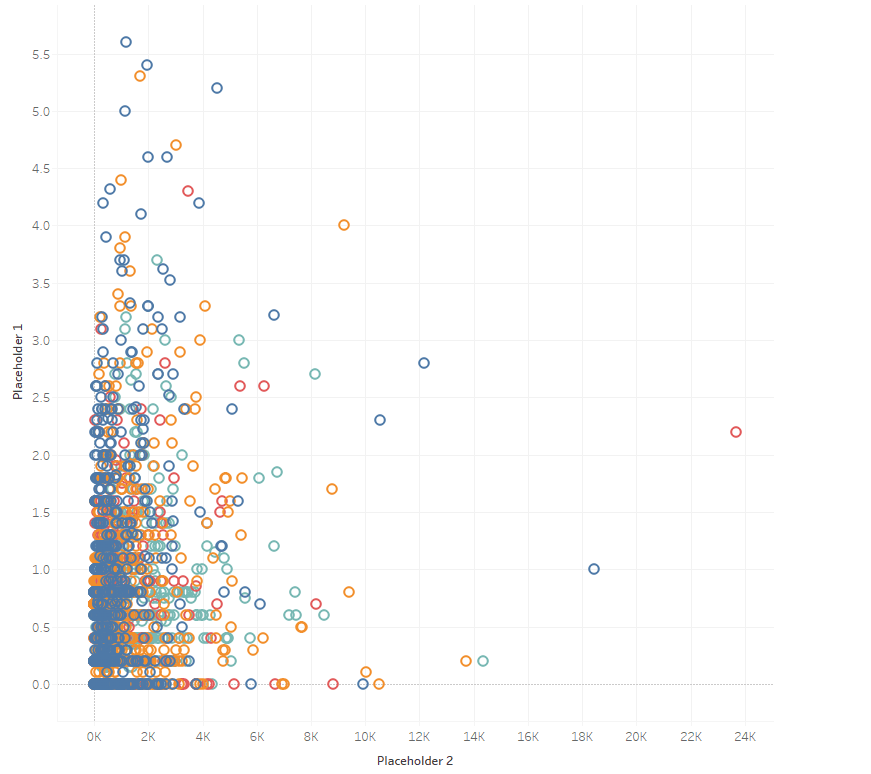
Now, let's change our placeholders so they aren't aggregated. Head to the Analysis menu on the top bar and untick Aggregate Measures.
Dynamically changing axes titles
You'll notice as you change the Choice Selectors that the axes titles don't change dynamically. Unfortunately they won't initially in Tableau, however, we can create a calculated field to make them update.
Head back to the dropdown arrow up the top of the Data pane. Select create Calculated Field.

Rename to 'X-Axis Title', and type in this code below.
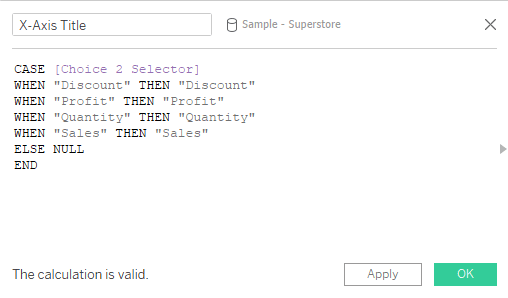
This CASE statement is saying when they select the text field Discount, then the axis title will display "Discount". There's an ELSE NULL statement in there - it won't make a difference as something will always be selected however if one of the selectors were empty it would display NULL as the title. Click OK.
Duplicate this X-Axis Title calculated field, change the name to Y-Axis Title, and change the CASE to Choice 1 Selector.
We now want to get rid of Placeholder 1 and Placeholder 2 titles. To do this, double click on Placeholder 1 on the graph, then select and delete the title. Do the same for Placeholder 2.
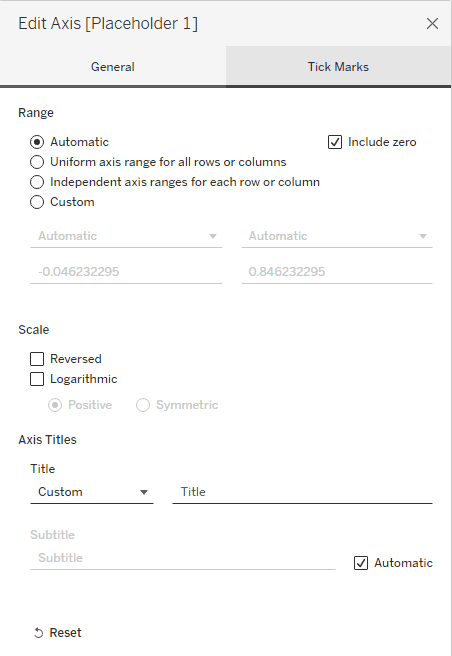
Now, drag X-Axis Title to Rows, and Y-Axis Title to columns.
Notice that whatever you have in your Choice Selectors, that is what's showing in the axis.
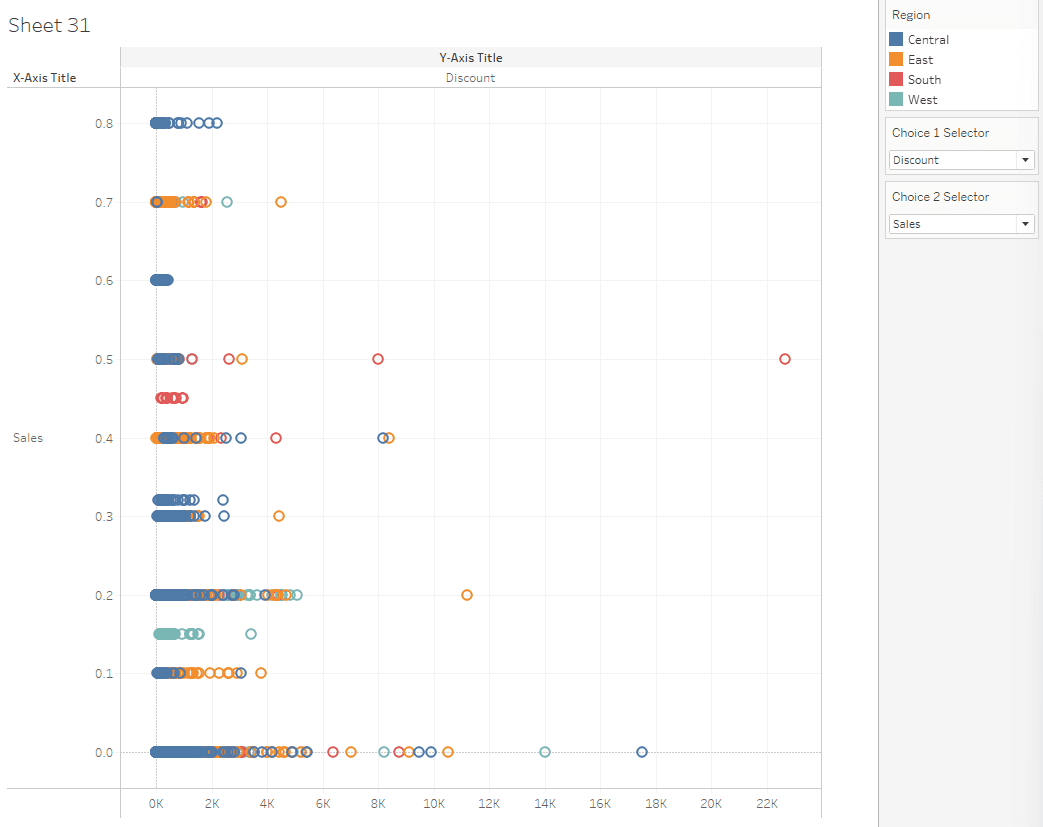
Right click on 'Sales' on the graph on the x axis and choose rotate label. Then, right click on X-Axis Title in the graph and choose Hide Field Labels for Rows. Right click on Y-Axis Title and choose Hide Field Labels for Columns.
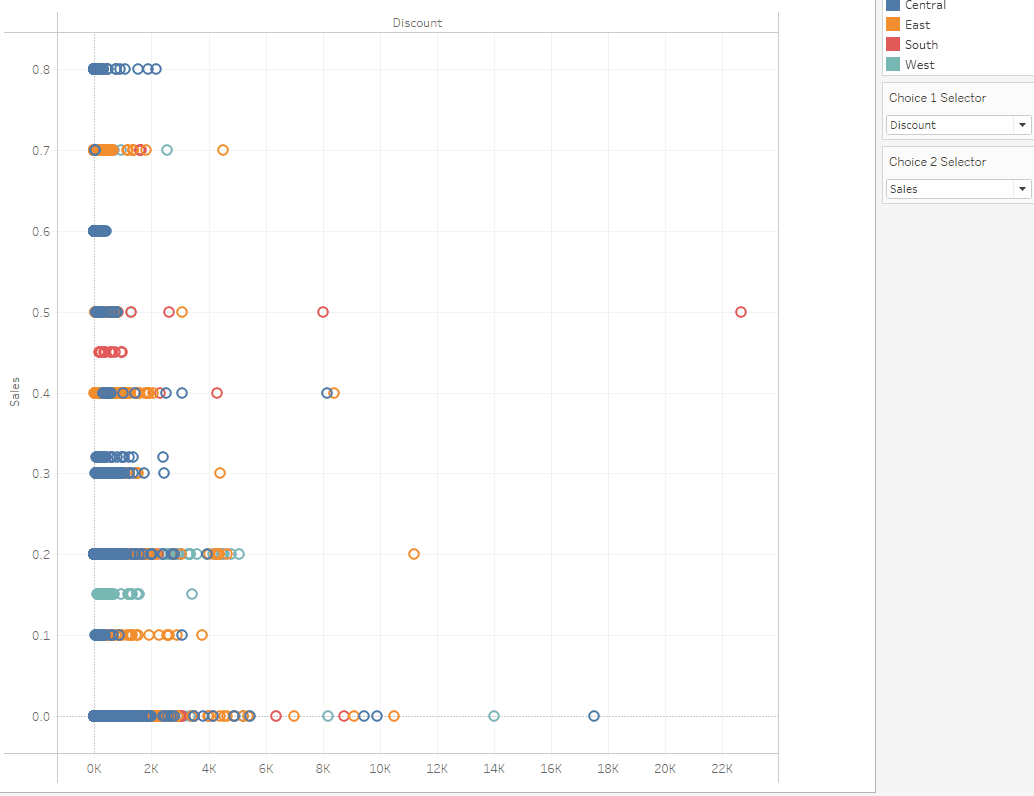
To rename the titles for our Choice Selectors, hover over them, choose the dropdown arrow and select Edit Title. I have renamed Choice 1 Selector and Choice 2 Selector to First Choice and Second Choice respectively.
KPIs
Go ahead and create a new sheet.
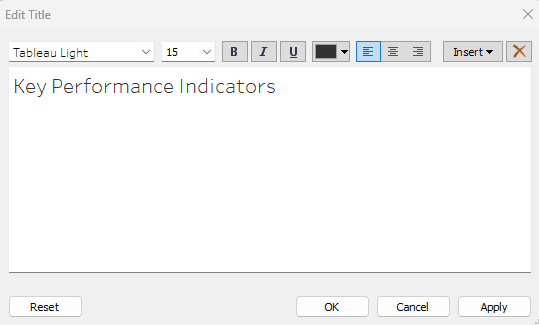
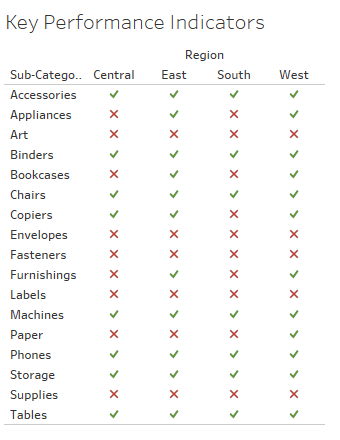
Double click on the title to rename it to 'Key Performance Indicators'.
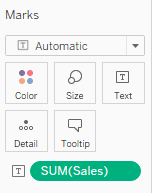
Drag and drop Region to Columns, and Sub-Category to Rows. Then, drag Sales to the Text box on the Marks card.
We now want to create the KPIs threshold. We do this via a calculated field.
Head to the Analysis menu up the top bar, and choose Create Calculated field.
Rename to KPI, and type the calculation below.
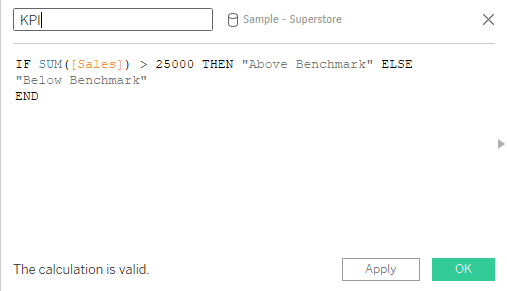
Here, we're saying if the sum of sales is greater than 25000 then we want the text "Above Benchmark". Otherwise we want the text "Below Benchmark".
Finally, we want to update the view to use KPI specific shape marks. In the Marks card where it says Automatic, we want to change it to Shape. Then we want to drag our KPI field from the Data pane onto the Shape box in the Marks card.
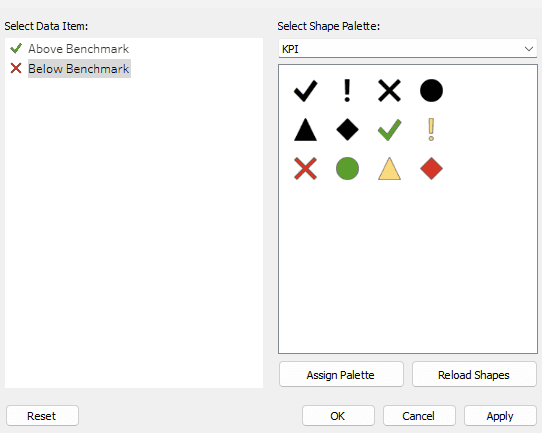
Click on the Shape box in the Marks card to edit the shapes. Change the Select Shape Palette to KPI. Change Above Benchmark to the green tick, and Below Benchmark to the red X. Click OK.
Now we just want our KPI marks not the numbers in the table. So in your Marks card, drag SUM(Sales) to the Detail box.
Ad Hoc calculations
Ad-hoc calculations are calculations that you can create and update as you work with a field on a shelf in the view. Ad-hoc calculations are also known as type-in or in-line calculations.
Go ahead and create a new worksheet. Drag Segment to Rows, then double click the Columns shelf. Type in 'AVG([Profit])/AVG([Sales])'. This gives us the average profit ratio.

Now right click anywhere in the visualization and go to Format. A Format pane will open on the left. Click on the Fields dropdown at the top, and choose our Ad Hoc calculation we just made for Columns.
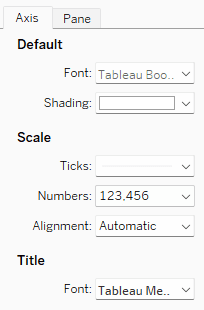
Click on the box next to Numbers and change it to Percentage, changing the decimal places to 0.
Make sure you are in the Sample Superstore workbook to start off.

Three levels of calculation
Tableau has three levels of calculation.

We will create a row level calculation to get started.
Create a new worksheet, drag Order Date and Sales to the Column shelf, then drag Ship mode to the Rows shelf.

Now, we will create a row calculation that will display the first word in the name of the Ship mode. I.e., First, Same, Second, and Standard.
Double click on Ship mode in the Rows shelf, then before the square brackets type 'SPLIT('
Then add a comma, open double quote, space, close double quote. This represents a space for the delimiter argument of SPLIT. We are saying that in the ship mode field, a space is what separates the first word from the second word.
Then we will do another comma, and type 1. 1 signifies the first block of text before the space.
Lastly add the closing parathesis and press enter.

Now we will create our aggregate basic calculation.
Create a new sheet and drag Order Date onto the Columns shelf. Using the Order Date dropdown, change it from Year to the first Quarter option.
Now, double click on the Rows shelf and type '[Sales]-[Profit]'
Click and drag SUM([Sales]-[Profit]) onto the Fields list
Once it's a part of the Fields list, right click and rename it 'Cost'.

We now want to convert the x axis from discrete to continuous. Notice in the Columns shelf that Order Date is blue. This represents discrete. Right click on it, and choose continuous.
Let's give this visualization more detail by adding another dimension and another measure to it.
Drag the Profit measure and Segment to the Rows shelf. What you'll see here is each Segment with its Cost and Profit.
Next, open the Show Me box in the top right hand corner. We want to select the Dual Lines chart.


Let's say we wanted to change the colours of the lines. Hover over the Measure Names legend, click the drop down, and click Edit Colours.

Click on Cost, then assign it a colour. Repeat for Profit.
We now want to add more granularity. Right click on the Order Date box in Columns, and change it to the second Month option. We are choosing this as it displays the month and the year.

We will now add a filter for interactivity. Right click on Order Date again, and choose Show Filter.
Now we want to change the background colour of our visualization. Right click on the plot, and choose Format. Under the Format Font pane to the left select the bucket icon and notice the worksheet default is white. Change your background colour there.
Creating parameters and calculated fields
It is time to create parameters.
In this lesson we will create two parameters, and two calculated fields. Make sure to close the Format Filter pane. In the Data pane you'll see icons next to the search bar. Click the dropdown arrow and select Create Parameter.


Name this parameter 'Choice 1 Selector', under Properties for the Data type change from Float to String, and under Allowable values change the option button to List.

Click where it says Click to add and type 'Discount'. Add another and type 'Profit'. Click to add again and type 'Quantity'. Finally click to add one more time and type 'Sales'. Click OK.
Notice in the Parameters section you'll see your new parameter. Now we want to duplicate it. Right click on your parameter, and choose duplicate. We will have 'Choice 1 Selector (copy)', right click on this, and choose Edit.

Rename to 'Choice 2 Selector', then click OK.
Now to create the first of our two calculated fields.
Head to the dropdown arrow at the top of the Data pane again, and select Create Calculated Field.

Rename to 'Placeholder 1', and type in the calculation below.

A CASE statement is very similar to the IF THEN ELSE IF ELSE construct. What this is saying is, when Discount is selected in the Choice 1 Selector parameter, then display the Discount field. So on and so forth. Click OK.
You should now see your new field in the Orders Table. Right click on it, and duplicate. Right click on its copy, and Edit.

Change the name to Placeholder 2, and change the CASE statement to [Choice 2 Selector]. Click OK.

Now is the time to pull it all together. Go ahead and create a new sheet.
Drag Placeholder 2 to Columns, and Placeholder 1 to Rows.
Drag Customer name to the Detail box in the Marks card, then drag Region to the colour box in the Marks card.
In the Data pane, we're going to right click on each of our created parameters and select Show Parameter.

Right now, both parameters are on Discount. Go to Choice 2 Selector and choose Sales.

Now, let's change our placeholders so they aren't aggregated. Head to the Analysis menu on the top bar and untick Aggregate Measures.
Dynamically changing axes titles
You'll notice as you change the Choice Selectors that the axes titles don't change dynamically. Unfortunately they won't initially in Tableau, however, we can create a calculated field to make them update.
Head back to the dropdown arrow up the top of the Data pane. Select create Calculated Field.

Rename to 'X-Axis Title', and type in this code below.

This CASE statement is saying when they select the text field Discount, then the axis title will display "Discount". There's an ELSE NULL statement in there - it won't make a difference as something will always be selected however if one of the selectors were empty it would display NULL as the title. Click OK.
Duplicate this X-Axis Title calculated field, change the name to Y-Axis Title, and change the CASE to Choice 1 Selector.
We now want to get rid of Placeholder 1 and Placeholder 2 titles. To do this, double click on Placeholder 1 on the graph, then select and delete the title. Do the same for Placeholder 2.

Now, drag X-Axis Title to Rows, and Y-Axis Title to columns.
Notice that whatever you have in your Choice Selectors, that is what's showing in the axis.

Right click on 'Sales' on the graph on the x axis and choose rotate label. Then, right click on X-Axis Title in the graph and choose Hide Field Labels for Rows. Right click on Y-Axis Title and choose Hide Field Labels for Columns.

To rename the titles for our Choice Selectors, hover over them, choose the dropdown arrow and select Edit Title. I have renamed Choice 1 Selector and Choice 2 Selector to First Choice and Second Choice respectively.
KPIs
Go ahead and create a new sheet.
Double click on the title to rename it to 'Key Performance Indicators'.

Drag and drop Region to Columns, and Sub-Category to Rows. Then, drag Sales to the Text box on the Marks card.

We now want to create the KPIs threshold. We do this via a calculated field.
Head to the Analysis menu up the top bar, and choose Create Calculated field.
Rename to KPI, and type the calculation below.

Here, we're saying if the sum of sales is greater than 25000 then we want the text "Above Benchmark". Otherwise we want the text "Below Benchmark".
Finally, we want to update the view to use KPI specific shape marks. In the Marks card where it says Automatic, we want to change it to Shape. Then we want to drag our KPI field from the Data pane onto the Shape box in the Marks card.
Click on the Shape box in the Marks card to edit the shapes. Change the Select Shape Palette to KPI. Change Above Benchmark to the green tick, and Below Benchmark to the red X. Click OK.

Now we just want our KPI marks not the numbers in the table. So in your Marks card, drag SUM(Sales) to the Detail box.

Ad Hoc calculations
Ad-hoc calculations are calculations that you can create and update as you work with a field on a shelf in the view. Ad-hoc calculations are also known as type-in or in-line calculations.
Go ahead and create a new worksheet. Drag Segment to Rows, then double click the Columns shelf. Type in 'AVG([Profit])/AVG([Sales])'. This gives us the average profit ratio.

Now right click anywhere in the visualization and go to Format. A Format pane will open on the left. Click on the Fields dropdown at the top, and choose our Ad Hoc calculation we just made for Columns.

Click on the box next to Numbers and change it to Percentage, changing the decimal places to 0.
Make sure you are in the Sample Superstore workbook to start off.

Three levels of calculation
Tableau has three levels of calculation.

We will create a row level calculation to get started.
Create a new worksheet, drag Order Date and Sales to the Column shelf, then drag Ship mode to the Rows shelf.

Now, we will create a row calculation that will display the first word in the name of the Ship mode. I.e., First, Same, Second, and Standard.
Double click on Ship mode in the Rows shelf, then before the square brackets type 'SPLIT('
Then add a comma, open double quote, space, close double quote. This represents a space for the delimiter argument of SPLIT. We are saying that in the ship mode field, a space is what separates the first word from the second word.
Then we will do another comma, and type 1. 1 signifies the first block of text before the space.
Lastly add the closing parathesis and press enter.

Now we will create our aggregate basic calculation.
Create a new sheet and drag Order Date onto the Columns shelf. Using the Order Date dropdown, change it from Year to the first Quarter option.
Now, double click on the Rows shelf and type '[Sales]-[Profit]'
Click and drag SUM([Sales]-[Profit]) onto the Fields list
Once it's a part of the Fields list, right click and rename it 'Cost'.

We now want to convert the x axis from discrete to continuous. Notice in the Columns shelf that Order Date is blue. This represents discrete. Right click on it, and choose continuous.
Let's give this visualization more detail by adding another dimension and another measure to it.
Drag the Profit measure and Segment to the Rows shelf. What you'll see here is each Segment with its Cost and Profit.
Next, open the Show Me box in the top right hand corner. We want to select the Dual Lines chart.


Let's say we wanted to change the colours of the lines. Hover over the Measure Names legend, click the drop down, and click Edit Colours.

Click on Cost, then assign it a colour. Repeat for Profit.
We now want to add more granularity. Right click on the Order Date box in Columns, and change it to the second Month option. We are choosing this as it displays the month and the year.

We will now add a filter for interactivity. Right click on Order Date again, and choose Show Filter.
Now we want to change the background colour of our visualization. Right click on the plot, and choose Format. Under the Format Font pane to the left select the bucket icon and notice the worksheet default is white. Change your background colour there.
Creating parameters and calculated fields
It is time to create parameters.
In this lesson we will create two parameters, and two calculated fields. Make sure to close the Format Filter pane. In the Data pane you'll see icons next to the search bar. Click the dropdown arrow and select Create Parameter.


Name this parameter 'Choice 1 Selector', under Properties for the Data type change from Float to String, and under Allowable values change the option button to List.

Click where it says Click to add and type 'Discount'. Add another and type 'Profit'. Click to add again and type 'Quantity'. Finally click to add one more time and type 'Sales'. Click OK.
Notice in the Parameters section you'll see your new parameter. Now we want to duplicate it. Right click on your parameter, and choose duplicate. We will have 'Choice 1 Selector (copy)', right click on this, and choose Edit.

Rename to 'Choice 2 Selector', then click OK.
Now to create the first of our two calculated fields.
Head to the dropdown arrow at the top of the Data pane again, and select Create Calculated Field.

Rename to 'Placeholder 1', and type in the calculation below.

A CASE statement is very similar to the IF THEN ELSE IF ELSE construct. What this is saying is, when Discount is selected in the Choice 1 Selector parameter, then display the Discount field. So on and so forth. Click OK.
You should now see your new field in the Orders Table. Right click on it, and duplicate. Right click on its copy, and Edit.

Change the name to Placeholder 2, and change the CASE statement to [Choice 2 Selector]. Click OK.

Now is the time to pull it all together. Go ahead and create a new sheet.
Drag Placeholder 2 to Columns, and Placeholder 1 to Rows.
Drag Customer name to the Detail box in the Marks card, then drag Region to the colour box in the Marks card.
In the Data pane, we're going to right click on each of our created parameters and select Show Parameter.

Right now, both parameters are on Discount. Go to Choice 2 Selector and choose Sales.

Now, let's change our placeholders so they aren't aggregated. Head to the Analysis menu on the top bar and untick Aggregate Measures.
Dynamically changing axes titles
You'll notice as you change the Choice Selectors that the axes titles don't change dynamically. Unfortunately they won't initially in Tableau, however, we can create a calculated field to make them update.
Head back to the dropdown arrow up the top of the Data pane. Select create Calculated Field.

Rename to 'X-Axis Title', and type in this code below.

This CASE statement is saying when they select the text field Discount, then the axis title will display "Discount". There's an ELSE NULL statement in there - it won't make a difference as something will always be selected however if one of the selectors were empty it would display NULL as the title. Click OK.
Duplicate this X-Axis Title calculated field, change the name to Y-Axis Title, and change the CASE to Choice 1 Selector.
We now want to get rid of Placeholder 1 and Placeholder 2 titles. To do this, double click on Placeholder 1 on the graph, then select and delete the title. Do the same for Placeholder 2.

Now, drag X-Axis Title to Rows, and Y-Axis Title to columns.
Notice that whatever you have in your Choice Selectors, that is what's showing in the axis.

Right click on 'Sales' on the graph on the x axis and choose rotate label. Then, right click on X-Axis Title in the graph and choose Hide Field Labels for Rows. Right click on Y-Axis Title and choose Hide Field Labels for Columns.

To rename the titles for our Choice Selectors, hover over them, choose the dropdown arrow and select Edit Title. I have renamed Choice 1 Selector and Choice 2 Selector to First Choice and Second Choice respectively.
KPIs
Go ahead and create a new sheet.
Double click on the title to rename it to 'Key Performance Indicators'.

Drag and drop Region to Columns, and Sub-Category to Rows. Then, drag Sales to the Text box on the Marks card.

We now want to create the KPIs threshold. We do this via a calculated field.
Head to the Analysis menu up the top bar, and choose Create Calculated field.
Rename to KPI, and type the calculation below.

Here, we're saying if the sum of sales is greater than 25000 then we want the text "Above Benchmark". Otherwise we want the text "Below Benchmark".
Finally, we want to update the view to use KPI specific shape marks. In the Marks card where it says Automatic, we want to change it to Shape. Then we want to drag our KPI field from the Data pane onto the Shape box in the Marks card.
Click on the Shape box in the Marks card to edit the shapes. Change the Select Shape Palette to KPI. Change Above Benchmark to the green tick, and Below Benchmark to the red X. Click OK.

Now we just want our KPI marks not the numbers in the table. So in your Marks card, drag SUM(Sales) to the Detail box.

Ad Hoc calculations
Ad-hoc calculations are calculations that you can create and update as you work with a field on a shelf in the view. Ad-hoc calculations are also known as type-in or in-line calculations.
Go ahead and create a new worksheet. Drag Segment to Rows, then double click the Columns shelf. Type in 'AVG([Profit])/AVG([Sales])'. This gives us the average profit ratio.

Now right click anywhere in the visualization and go to Format. A Format pane will open on the left. Click on the Fields dropdown at the top, and choose our Ad Hoc calculation we just made for Columns.

Click on the box next to Numbers and change it to Percentage, changing the decimal places to 0.
CONTENT
SHARE