CONTENT
5 design tricks for Power BI dashboards
Enhance your Power BI dashboard's visual appeal with alignment, white space, rounded corners, shadows, and custom backgrounds from PowerPoint.


Saartje Ly
Data Engineering Intern
May 11, 2024
Alignment
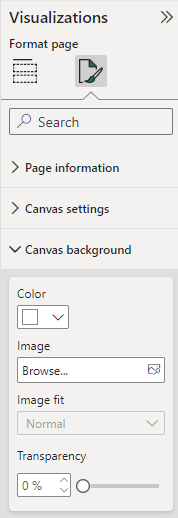
1. Under Canvas background, in the Visualizations pane, change the color of the background to be able to clearly see the borders of the visuals.
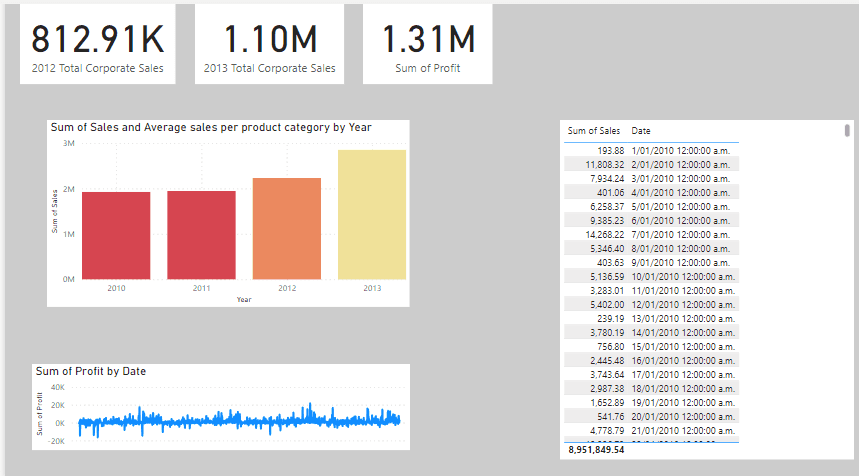
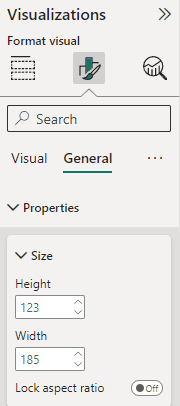
2. When we talk about alignment we also have to consider the size of the visuals. For example, we would like the three cards at the top to be the same size. Select the cards, head to General under Format visual, Properties, then change the width and the height.

3. We now need to position them.
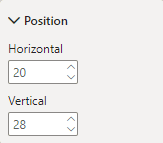
You are able to change the numerical position on the canvas in position under Properties.
You can also Align them automatically following these steps:
4. Navigate to the Format tab
5. Select the Align drop down
Here you can choose the types of alignment for your objects.
While selected, you can also move your aligned objects as one group and place them where you need to.
I have selected the Distribute horizontally option.
Whitespace
You’ll notice that the title of each visual is squeezed to the border. This isn’t great, and we’d like to add white space to the visuals.
1. Head to the Insert tab up the top
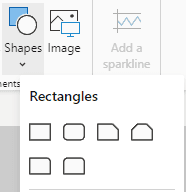
2. Click on shapes, then choose a rectangle.
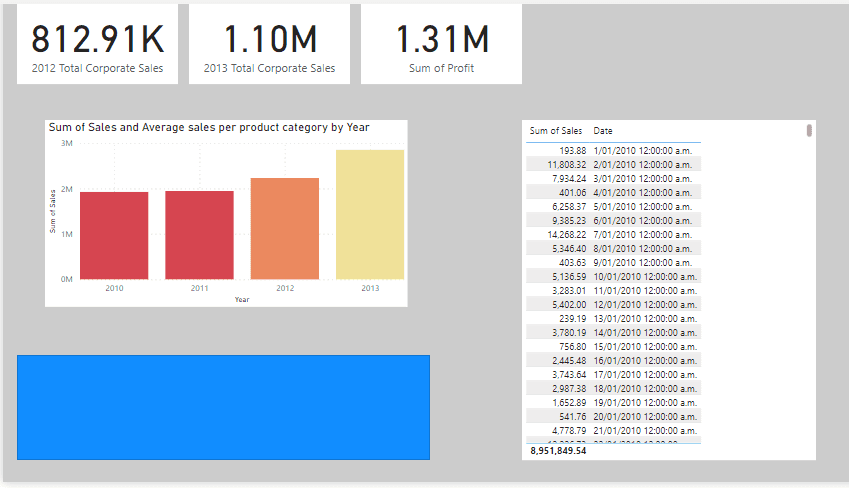
3. Place this rectangle over a visual, making the size the exact same as the visual.
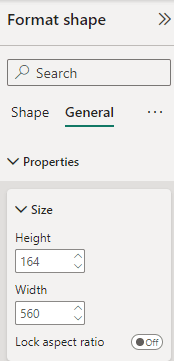
4. We now want this rectangle to be slightly bigger; specifically 20 pixels more on each side. Click on the rectangle, head to the Format shape pane, General, Properties, then increase the width and height by 40.
5. We now want to send it to the back. To send it to the back, navigate to the Format tab up the top, and click Send backward inside Arrange.
Reposition the rectangle if needed.

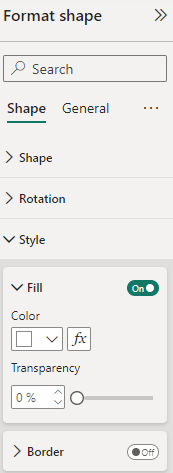
6. Adjust the rectangle colour to the same colour as the visualizations background. With the rectangle selected, head to the Format shape pane, slick Style, then change the colour there. We also want to turn Border off.

Apply this to all your visualizations.
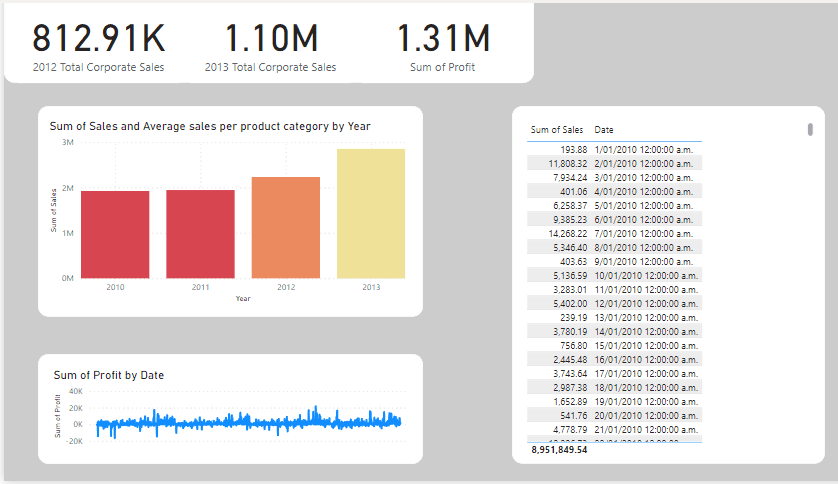
Rounded corners
1. Select the shape that we have at the background of each visual.
2. Head to General in the Format shape pane. Under Effects, turn the Background on, and turn Visual border on. Make sure the colour is the same colour as your background. Increase Rounded corners to 15.


Change all visualization borders.
Borders and shadows
1. Select your background shape behind your visual
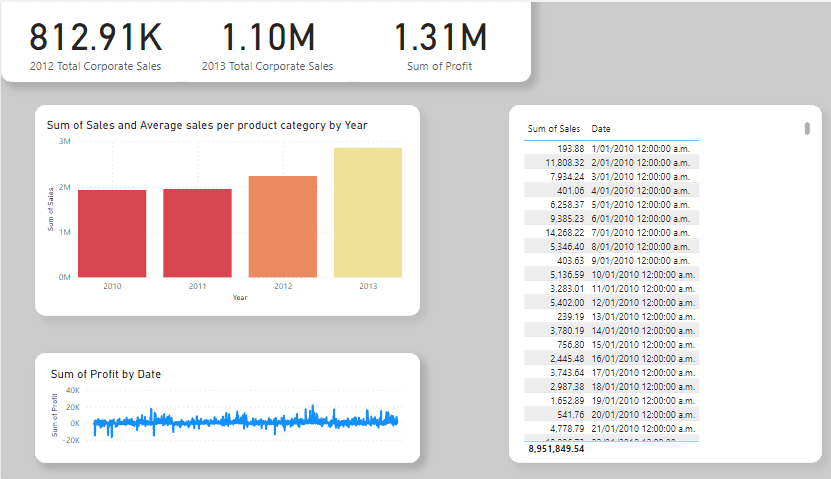
2. Turn on shadow under Effects in General, Format shape.

Choose custom in Position to further customize your shadow. With just a little bit of shadow, we can give the impression that the visual is separated from the background.
Colour theme and background
1. Create a background design for your Power BI dashboard in PowerPoint
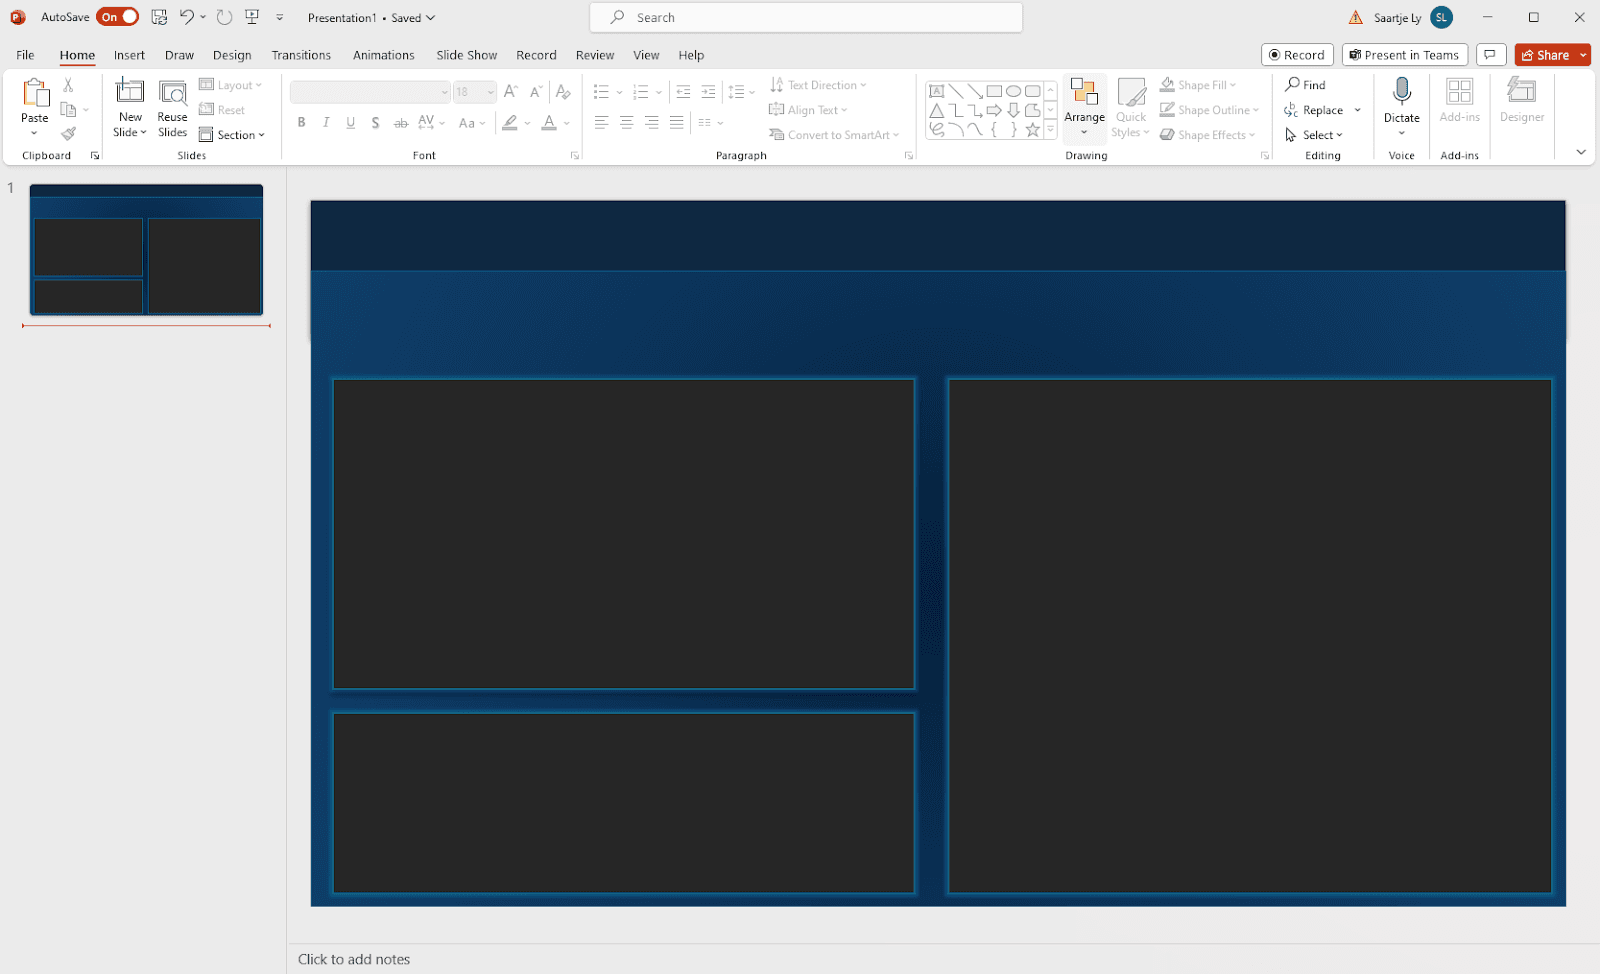
Here, I have a PowerPoint slide with different objects creating the structure.
2. Go to File, Save a Copy, and save your PowerPoint as a .svg.
Then head back to Power BI.
3. All the shapes we have as background shapes (the rectangles we previously used), select and delete.
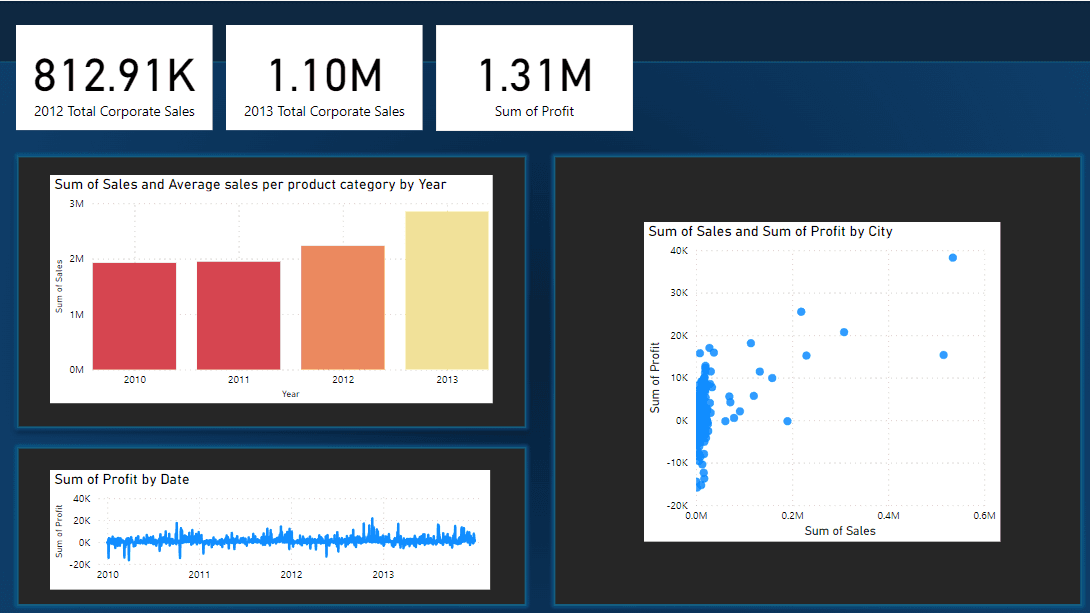
4. Head to Canvas background in Format page, and choose your Image from PowerPoint. Set Image fit to Fit.
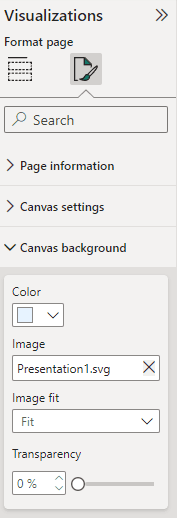
5. Change the background of all visualizations to match the colour of the background from your PowerPoint under Effects in General, Format visual.
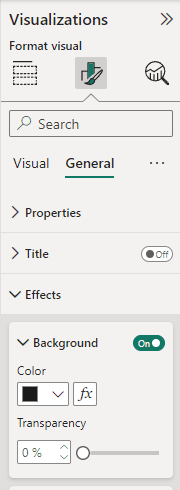
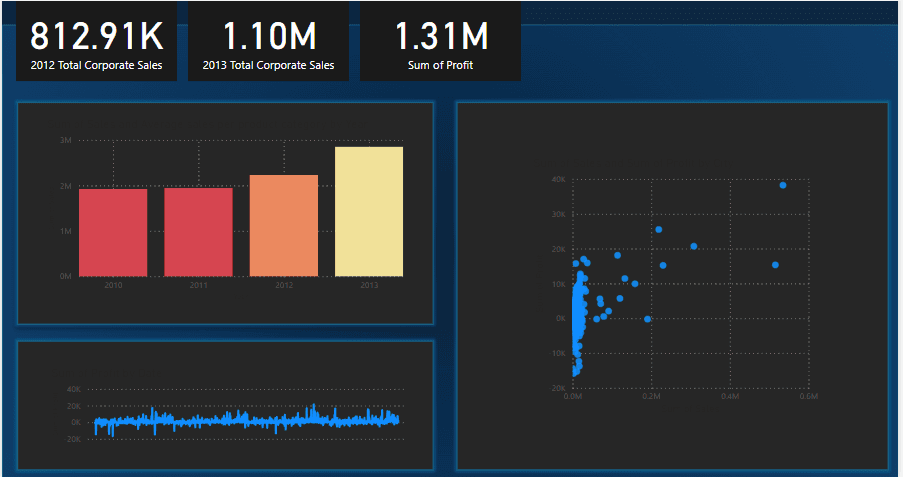
6. Change the colour of the text under Visual, in Callout value and Category label. OR, it will be under Values in X-axis, and Y-axis.

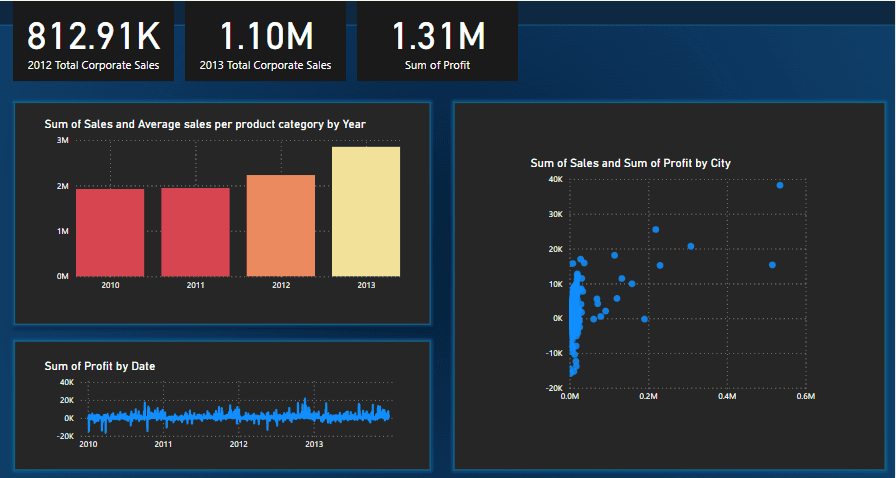
7. Make sure the titles of your visualizations are visible. In General in Format visual, open the Title box to change the colour.
Alignment
1. Under Canvas background, in the Visualizations pane, change the color of the background to be able to clearly see the borders of the visuals.


2. When we talk about alignment we also have to consider the size of the visuals. For example, we would like the three cards at the top to be the same size. Select the cards, head to General under Format visual, Properties, then change the width and the height.


3. We now need to position them.

You are able to change the numerical position on the canvas in position under Properties.
You can also Align them automatically following these steps:
4. Navigate to the Format tab
5. Select the Align drop down
Here you can choose the types of alignment for your objects.
While selected, you can also move your aligned objects as one group and place them where you need to.
I have selected the Distribute horizontally option.
Whitespace
You’ll notice that the title of each visual is squeezed to the border. This isn’t great, and we’d like to add white space to the visuals.
1. Head to the Insert tab up the top
2. Click on shapes, then choose a rectangle.

3. Place this rectangle over a visual, making the size the exact same as the visual.

4. We now want this rectangle to be slightly bigger; specifically 20 pixels more on each side. Click on the rectangle, head to the Format shape pane, General, Properties, then increase the width and height by 40.

5. We now want to send it to the back. To send it to the back, navigate to the Format tab up the top, and click Send backward inside Arrange.
Reposition the rectangle if needed.

6. Adjust the rectangle colour to the same colour as the visualizations background. With the rectangle selected, head to the Format shape pane, slick Style, then change the colour there. We also want to turn Border off.


Apply this to all your visualizations.
Rounded corners
1. Select the shape that we have at the background of each visual.
2. Head to General in the Format shape pane. Under Effects, turn the Background on, and turn Visual border on. Make sure the colour is the same colour as your background. Increase Rounded corners to 15.


Change all visualization borders.

Borders and shadows
1. Select your background shape behind your visual
2. Turn on shadow under Effects in General, Format shape.

Choose custom in Position to further customize your shadow. With just a little bit of shadow, we can give the impression that the visual is separated from the background.

Colour theme and background
1. Create a background design for your Power BI dashboard in PowerPoint

Here, I have a PowerPoint slide with different objects creating the structure.
2. Go to File, Save a Copy, and save your PowerPoint as a .svg.
Then head back to Power BI.
3. All the shapes we have as background shapes (the rectangles we previously used), select and delete.
4. Head to Canvas background in Format page, and choose your Image from PowerPoint. Set Image fit to Fit.


5. Change the background of all visualizations to match the colour of the background from your PowerPoint under Effects in General, Format visual.


6. Change the colour of the text under Visual, in Callout value and Category label. OR, it will be under Values in X-axis, and Y-axis.

7. Make sure the titles of your visualizations are visible. In General in Format visual, open the Title box to change the colour.

Alignment
1. Under Canvas background, in the Visualizations pane, change the color of the background to be able to clearly see the borders of the visuals.


2. When we talk about alignment we also have to consider the size of the visuals. For example, we would like the three cards at the top to be the same size. Select the cards, head to General under Format visual, Properties, then change the width and the height.


3. We now need to position them.

You are able to change the numerical position on the canvas in position under Properties.
You can also Align them automatically following these steps:
4. Navigate to the Format tab
5. Select the Align drop down
Here you can choose the types of alignment for your objects.
While selected, you can also move your aligned objects as one group and place them where you need to.
I have selected the Distribute horizontally option.
Whitespace
You’ll notice that the title of each visual is squeezed to the border. This isn’t great, and we’d like to add white space to the visuals.
1. Head to the Insert tab up the top
2. Click on shapes, then choose a rectangle.

3. Place this rectangle over a visual, making the size the exact same as the visual.

4. We now want this rectangle to be slightly bigger; specifically 20 pixels more on each side. Click on the rectangle, head to the Format shape pane, General, Properties, then increase the width and height by 40.

5. We now want to send it to the back. To send it to the back, navigate to the Format tab up the top, and click Send backward inside Arrange.
Reposition the rectangle if needed.

6. Adjust the rectangle colour to the same colour as the visualizations background. With the rectangle selected, head to the Format shape pane, slick Style, then change the colour there. We also want to turn Border off.


Apply this to all your visualizations.
Rounded corners
1. Select the shape that we have at the background of each visual.
2. Head to General in the Format shape pane. Under Effects, turn the Background on, and turn Visual border on. Make sure the colour is the same colour as your background. Increase Rounded corners to 15.


Change all visualization borders.

Borders and shadows
1. Select your background shape behind your visual
2. Turn on shadow under Effects in General, Format shape.

Choose custom in Position to further customize your shadow. With just a little bit of shadow, we can give the impression that the visual is separated from the background.

Colour theme and background
1. Create a background design for your Power BI dashboard in PowerPoint

Here, I have a PowerPoint slide with different objects creating the structure.
2. Go to File, Save a Copy, and save your PowerPoint as a .svg.
Then head back to Power BI.
3. All the shapes we have as background shapes (the rectangles we previously used), select and delete.
4. Head to Canvas background in Format page, and choose your Image from PowerPoint. Set Image fit to Fit.


5. Change the background of all visualizations to match the colour of the background from your PowerPoint under Effects in General, Format visual.


6. Change the colour of the text under Visual, in Callout value and Category label. OR, it will be under Values in X-axis, and Y-axis.

7. Make sure the titles of your visualizations are visible. In General in Format visual, open the Title box to change the colour.

CONTENT
SHARE