CONTENT
An introduction to Power BI
Discover how Power BI transforms data into interactive reports and dashboards, providing insightful business intelligence and enhancing data-driven decision-making.


Saartje Ly
Data Engineering Intern
Introduction
Power BI is a powerful visualization and business intelligence tool developed by Microsoft. It converts data from different sources to creating interactive reports and dashboards, and offers features for data analysis and modeling. Power BI allows users to share their reports and dashboards internally and externally, also offering mobile apps for iOS, Android, and Windows devices, allowing users to access their reports and dashboards from anywhere.
Power BI Desktop is available for download at this link:
Click here to Download Power BI
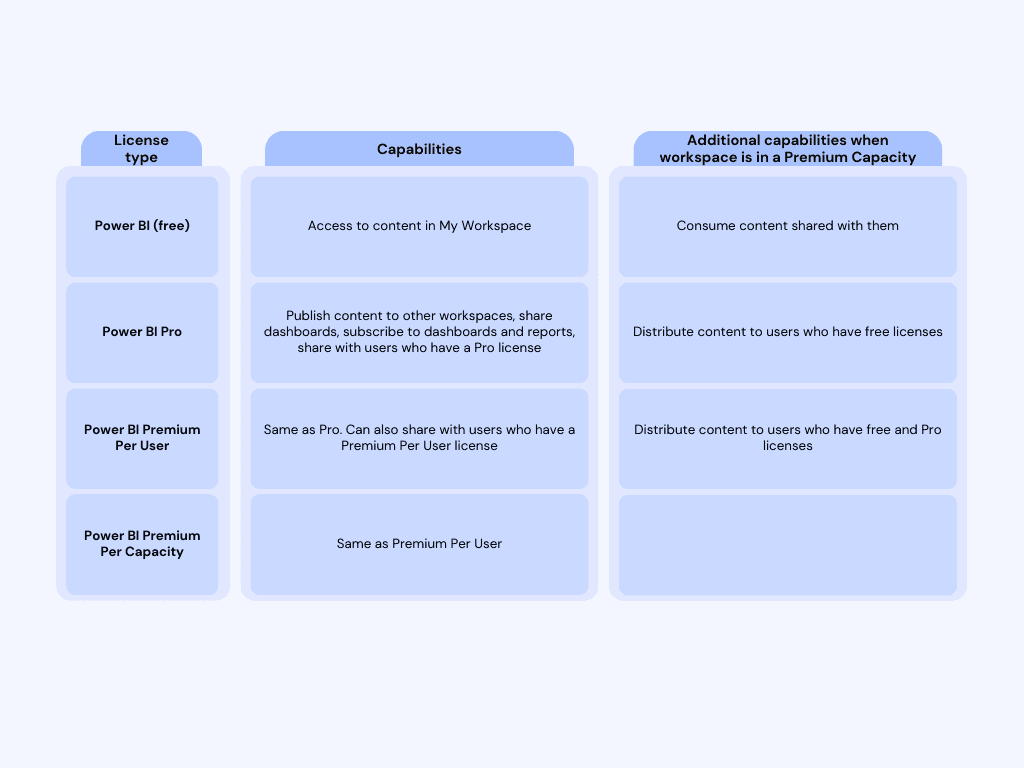
License types
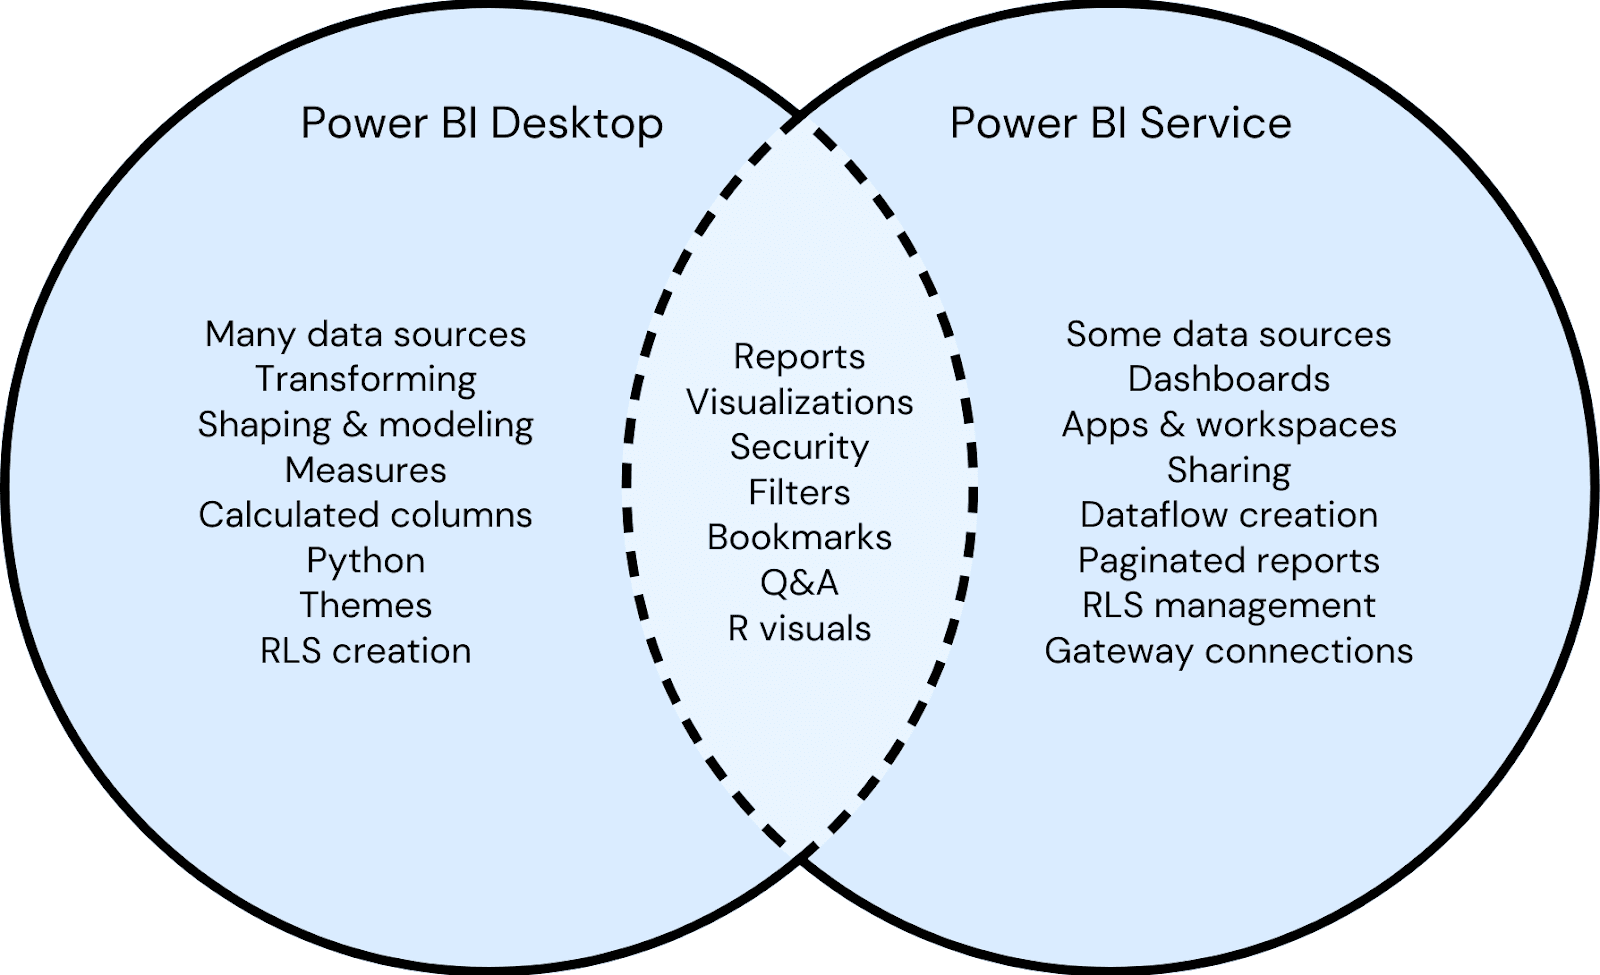
Components of Power BI
Power BI Desktop
Transform, analyze, shape and model data.
Make visualizations/reports.
Create measures (think aggregations, ratios, or comparisons)
Create calculated columns (creating new columns for your dataset based on calculations)
Access to Power Query editor (allows you to transform, clean, and shape your data before it gets loaded into your Power BI dataset)
Publish to Power BI Service
Power BI Service
Your Power BI account in the cloud
Create visualizations/reports
Create paginated reports
Make dashboards
Power BI Report builder
Design and create paginated reports to publish to Power BI Service
Your first step after launching the Power BI Desktop app is to log in.
Find the Sign in icon and enter your Microsoft account details.
Loading data in
1. Inside the home tab, click Get data, and select the correct data source

2. Navigate to your data folder and select your data
3. Tick all tables you would like to load

4. Click load
Views
Report view, table view, and model view can be accessed in the left bar of the window.
Table view displays your tables of data.
Clicking on a field in the right hand corner is a shortcut to jump to that field in the view.
The bottom left corner tells us how many rows we have in our table, and how many distinct values the current selected field has.
Model view shows a card for every table that Power BI is connected to from your data source.
The Data pane has a search bar which is handy to search for a required field
You can add another page to put grouped fields on a separate page so it doesn’t get overwhelming
Updating a dataset locally
Refreshing source data means updating the data in your reports and datasets to reflect changes made in the original data sources.
If changes to your data have been made locally, then in the desktop app:
1. Click the Home tab
2. Click Refresh in the Queries section
The changes should be reflected in your dataset.
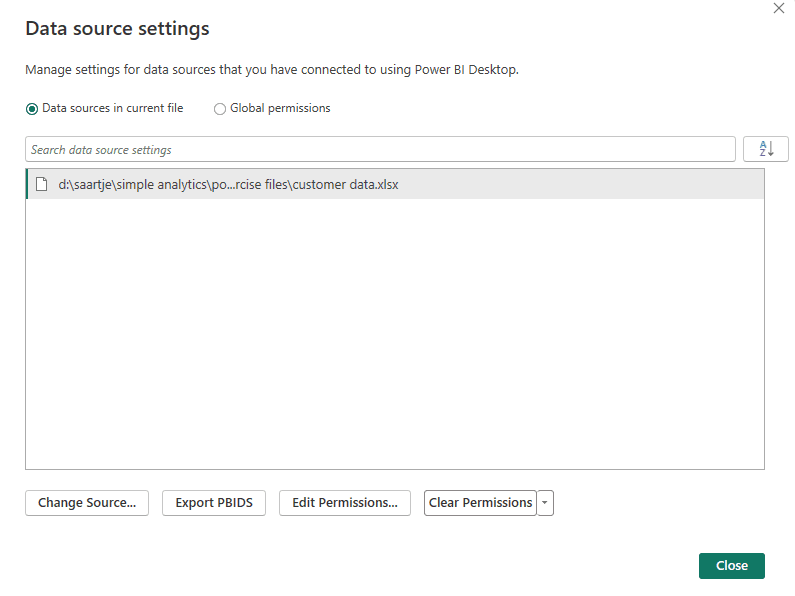
Moving a dataset that is in use
After you create a Power BI file with data, if you would like to move your data outside of the current working directory, follow these steps.
1. Move your data to the desired location
2. Click on the File tab
3. Select Options and Settings in the left hand bar
4. Select Data source settings
You’ll notice that the path to the data is pointing to where the data originally was.
5. Select this path, then in the lower left hand corner click Change Source.
6. Click on Browse
7. Browse to where you moved the data, then double click the data
8. Click close on the Data source settings window
9. Select Apply changes
Basic visualization
1. Select a visual from the Visualizations pane

2. Select the data you’d like to visualize in the Data pane
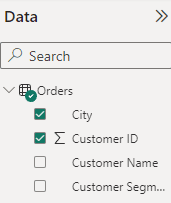
Note, the sigma symbol in front of a field indicates that data is numeric

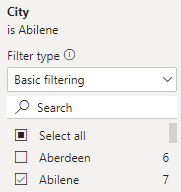
3. Filter data in the Filters pane if necessary.
For example, looking at the count of Customer ID for city Abilene

We can add multiple pages, ie, multiple blank canvases down the bottom
Publishing
1. In the Home tab, click the Publish button
2. Select your workspace
Once published, you can access it through the Power BI Service
Click here to see our Power BI Services
Introduction
Power BI is a powerful visualization and business intelligence tool developed by Microsoft. It converts data from different sources to creating interactive reports and dashboards, and offers features for data analysis and modeling. Power BI allows users to share their reports and dashboards internally and externally, also offering mobile apps for iOS, Android, and Windows devices, allowing users to access their reports and dashboards from anywhere.
Power BI Desktop is available for download at this link:
Click here to Download Power BI
License types
Components of Power BI
Power BI Desktop
Transform, analyze, shape and model data.
Make visualizations/reports.
Create measures (think aggregations, ratios, or comparisons)
Create calculated columns (creating new columns for your dataset based on calculations)
Access to Power Query editor (allows you to transform, clean, and shape your data before it gets loaded into your Power BI dataset)
Publish to Power BI Service
Power BI Service
Your Power BI account in the cloud
Create visualizations/reports
Create paginated reports
Make dashboards
Power BI Report builder
Design and create paginated reports to publish to Power BI Service
Your first step after launching the Power BI Desktop app is to log in.
Find the Sign in icon and enter your Microsoft account details.
Loading data in
1. Inside the home tab, click Get data, and select the correct data source
2. Navigate to your data folder and select your data
3. Tick all tables you would like to load
4. Click load
Views
Report view, table view, and model view can be accessed in the left bar of the window.
Table view displays your tables of data.
Clicking on a field in the right hand corner is a shortcut to jump to that field in the view.
The bottom left corner tells us how many rows we have in our table, and how many distinct values the current selected field has.
Model view shows a card for every table that Power BI is connected to from your data source.
The Data pane has a search bar which is handy to search for a required field
You can add another page to put grouped fields on a separate page so it doesn’t get overwhelming
Updating a dataset locally
Refreshing source data means updating the data in your reports and datasets to reflect changes made in the original data sources.
If changes to your data have been made locally, then in the desktop app:
1. Click the Home tab
2. Click Refresh in the Queries section
The changes should be reflected in your dataset.
Moving a dataset that is in use
After you create a Power BI file with data, if you would like to move your data outside of the current working directory, follow these steps.
1. Move your data to the desired location
2. Click on the File tab
3. Select Options and Settings in the left hand bar
4. Select Data source settings
You’ll notice that the path to the data is pointing to where the data originally was.
5. Select this path, then in the lower left hand corner click Change Source.
6. Click on Browse
7. Browse to where you moved the data, then double click the data
8. Click close on the Data source settings window
9. Select Apply changes
Basic visualization
1. Select a visual from the Visualizations pane
2. Select the data you’d like to visualize in the Data pane
Note, the sigma symbol in front of a field indicates that data is numeric
3. Filter data in the Filters pane if necessary.
For example, looking at the count of Customer ID for city Abilene
We can add multiple pages, ie, multiple blank canvases down the bottom
Publishing
1. In the Home tab, click the Publish button
2. Select your workspace
Once published, you can access it through the Power BI Service
Click here to see our Power BI Services
CONTENT
SHARE