
What is Power BI?
Power BI is Microsoft's business analytics platform enabling organizations to visualize data, share information and allow the business to make decisions using live facts and numbers to achieve business goals. No need for multiple systems.
Beyond Dashboards: A Modern Analytics Platform
Bring data from multiple systems into a central Microsoft Fabric Lakehouse and create a single source of truth for your organisation. Power BI turns that data into dashboards and reports, while AI and Copilot unlock new ways to explore and act on your information.
Modern Analytics Architecture
From raw business data to governed dashboards, AI insights and decision-ready reporting.
Data Sources
APIs, spreadsheets, databases and business systems.
Microsoft Fabric
Lakehouse, pipelines and governed data platform.
Semantic Model
Trusted KPIs, business logic and reusable metrics.
Insights & AI
Power BI reports, AI agents and decision support.
Our Power BI Services

Build Power BI Dashboards
We build self-service Power BI dashboards that inform your business of key information to drive your business goals.
AI Services (POC)
Introducing data agents to complement your analytics. Leverage AI-powered agents on curated semantic models to enable natural language insights directly within Power BI.


Power BI Training
Build a Power BI Centre of Excellence. We provide practical workshops to enable users to build their dashboards with best practices.
Consulting Services
Power BI dashboards are the start of building a data-driven culture. We provide consulting to help organisations with storytelling to drive business goals and employee behaviour.

Example Power BI Dashboards


What our Customers have to say

Tim Wilson
Highly recommended. Max and Jackie readily understood our relatively complex requirements and were very responsive to our feedback as we iteratively built our dashboards. A great development experience at reasonable cost and we look forward to continuing to work with the team as we develop our data insight environment further.
Shane Hutchinson
Great team to work with and even better results.
William Wang
The engagement was highly productive, with Jackie delivering a fit-for-purpose solution that achieved strong outcomes within a tight timeframe.
Glass Tower
What a great group of people to work with. It's often hard to find value-for-money, responsive and straightforward partners in this space, so finding Max and Jackie has been a real relief. Simple Analytics has rescued our clunky old Power BI dashboards and turned them into genuinely useful and user friendly tools without pushing us into a whole rebuild. We would recommend them to other marketing and comms professionals looking to make the most of deeper data-driven insights.
Ajay Shankar
Have been working with Jackie for a few months and his work/insights has made a significant difference to our business. We’ve been able to identify gaps and trends with meaningful reporting available which has been pretty remarkable – but I’d always like to see more! Thank you Jackie for all the help!
Jeremy Wilson
We recently partnered with Simple Analytics and the experience was exceptional. The team were very knowledgeable with Power BI and truly understood the challenges faced by our business. They took their time to understand our business requirements and developed solutions that fit our needs. Their commitment to ensuring we got the most value out of our investment really stood out. The developed application and Power BI dashboards they implemented are easy to use, intuitive, and have become a key piece to our daily operations. We now have a much clearer view of our business - allowing us to make faster, smarter, and data-driven decisions.
Bring All Your Data into One Place
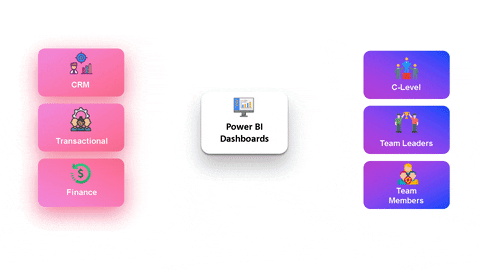
Power BI enables organizations to connect to multiple data sources such as CRM, Financials, Google Analytics, and much more to give a 360-degree view of the Business. It provides users to interact with the data, self-serve, and collaborate.
Being a Microsoft product it integrates with other Microsoft products such as Teams for Collaboration Purposes, Powerpoint for live data presentions, Power Automate to run flows, and much more.
Unlock opportunities from your Data using Power BI.
Our Power BI Core Values

Keep it Simple
We don't overcomplicate things. At Simple Analytics we design simple, easy-to-use Power BI Dashboards. Our core foundation skills allow us to build high-quality Power BI dashboards at cost-effective rates.

Make it interactive
Power BI provides a range of features to provide an On-Demand and Self-Service experience to its Users. From sharing via desktop or mobile app to slicing and dicing data and an exclusive range of bookmarking, navigation and much more to drive a story from your data.

Drive business goals
Empower your business with key insights to make the right decisions for your business. Drive performance indicators directly relating to your business goals with data Transform your organization into becoming data-driven with Power BI.
"Have been working with Jackie for a few months and his work/insights has made a significant difference to our business. We’ve been able to identify gaps and trends with meaningful reporting available which has been pretty remarkable – but I’d always like to see more! Thank you Jackie for all the help!"
Ajay Shankar
Capital & Asset Manager
-
Te Whatu Ora
Power BI Case Studies

Nationwide – Power BI Embedded & Microsoft Fabric Customer Portal Solution
See how we developed an external facing app using Microsoft fabric & Power BI embedded for Australia's leading waste management company

Life Insurance Semantic Model
PPS partnered with Simple Analytics to build a scalable semantic model, enabling consistent sales metrics, improved pipeline visibility, and a strong foundation for AI-driven insights.
Frequently Asked Questions
What is a BI Dashboard?
What are the benefits of a BI Dashboard?
What tools are used for creating BI dashboards?
Is Microsoft Power BI free?
How can I ensure my BI dashboard provides a good return on investment?
Have a Question?
Please feel free to reach out and our friendly team will be happy to help
What is Power BI?
Power BI is Microsoft's business analytics platform enabling organizations to visualize data, share information and allow the business to make decisions using live facts and numbers to achieve business goals. No need for multiple systems.
Beyond Dashboards: A Modern Analytics Platform
Bring data from multiple systems into a central Microsoft Fabric Lakehouse and create a single source of truth for your organisation. Power BI turns that data into dashboards and reports, while AI and Copilot unlock new ways to explore and act on your information.
Our Power BI Services
Build Power BI Dashboards
We build self-service Power BI dashboards that inform your business of key information to drive your business goals.
AI Services (POC)
Introducing data agents to complement your analytics. Leverage AI-powered agents on curated semantic models to enable natural language insights directly within Power BI.
Power BI Training
Build a Power BI Centre of Excellence. We provide practical workshops to enable users to build their dashboards with best practices.
Consulting Services
Power BI dashboards are the start of building a data-driven culture. We provide consulting to help organisations with storytelling to drive business goals and employee behaviour.
Example Power BI Dashboards
What our Customers have to say
Tim Wilson
Highly recommended. Max and Jackie readily understood our relatively complex requirements and were very responsive to our feedback as we iteratively built our dashboards. A great development experience at reasonable cost and we look forward to continuing to work with the team as we develop our data insight environment further.
Shane Hutchinson
Great team to work with and even better results.
William Wang
The engagement was highly productive, with Jackie delivering a fit-for-purpose solution that achieved strong outcomes within a tight timeframe.
Glass Tower
What a great group of people to work with. It's often hard to find value-for-money, responsive and straightforward partners in this space, so finding Max and Jackie has been a real relief. Simple Analytics has rescued our clunky old Power BI dashboards and turned them into genuinely useful and user friendly tools without pushing us into a whole rebuild. We would recommend them to other marketing and comms professionals looking to make the most of deeper data-driven insights.
Ajay Shankar
Have been working with Jackie for a few months and his work/insights has made a significant difference to our business. We’ve been able to identify gaps and trends with meaningful reporting available which has been pretty remarkable – but I’d always like to see more! Thank you Jackie for all the help!
Jeremy Wilson
We recently partnered with Simple Analytics and the experience was exceptional. The team were very knowledgeable with Power BI and truly understood the challenges faced by our business. They took their time to understand our business requirements and developed solutions that fit our needs. Their commitment to ensuring we got the most value out of our investment really stood out. The developed application and Power BI dashboards they implemented are easy to use, intuitive, and have become a key piece to our daily operations. We now have a much clearer view of our business - allowing us to make faster, smarter, and data-driven decisions.
Bring All Your Data into One Place
Power BI enables organizations to connect to multiple data sources such as CRM, Financials, Google Analytics, and much more to give a 360-degree view of the Business. It provides users to interact with the data, self-serve, and collaborate.
Being a Microsoft product it integrates with other Microsoft products such as Teams for Collaboration Purposes, Powerpoint for live data presentions, Power Automate to run flows, and much more.
Unlock opportunities from your Data using Power BI.
Our Power BI Core Values
Keep it Simple
Make it interactive
Drive business goals
"Have been working with Jackie for a few months and his work/insights has made a significant difference to our business. We’ve been able to identify gaps and trends with meaningful reporting available which has been pretty remarkable – but I’d always like to see more! Thank you Jackie for all the help!"
Ajay Shankar
Capital & Asset Manager
-
Te Whatu Ora
Power BI Case Studies
Nationwide – Power BI Embedded & Microsoft Fabric Customer Portal Solution
See how we developed an external facing app using Microsoft fabric & Power BI embedded for Australia's leading waste management company
Life Insurance Semantic Model
PPS partnered with Simple Analytics to build a scalable semantic model, enabling consistent sales metrics, improved pipeline visibility, and a strong foundation for AI-driven insights.
Frequently Asked Questions
What is a BI Dashboard?
What are the benefits of a BI Dashboard?
What tools are used for creating BI dashboards?
Is Microsoft Power BI free?
How can I ensure my BI dashboard provides a good return on investment?
Have a Question?
Please feel free to reach out and our friendly team will be happy to help
What is Power BI?
Power BI is Microsoft's business analytics platform enabling organizations to visualize data, share information and allow the business to make decisions using live facts and numbers to achieve business goals. No need for multiple systems.
Beyond Dashboards Modern Analytics Platform
Bring data from multiple systems into a central Microsoft Fabric Lakehouse and create a single source of truth for your organisation. Power BI turns that data into dashboards and reports, while AI and Copilot unlock new ways to explore and act on your information.
Our Power BI Services
Build Power BI Dashboards
We build self-service Power BI dashboards that inform your business of key information to drive your business goals.
AI Services (POC)
Introducing data agents to complement your analytics. Leverage AI-powered agents on curated semantic models to enable natural language insights directly within Power BI.
Power BI Training
Build a Power BI Centre of Excellence. We provide practical workshops to enable users to build their dashboards with best practices.
Consulting Services
Power BI dashboards are the start of building a data-driven culture. We provide consulting to help organisations with storytelling to drive business goals and employee behaviour.
Example Power BI Dashboards
What our Customers have to say
Tim Wilson
Highly recommended. Max and Jackie readily understood our relatively complex requirements and were very responsive to our feedback as we iteratively built our dashboards. A great development experience at reasonable cost and we look forward to continuing to work with the team as we develop our data insight environment further.
Shane Hutchinson
Great team to work with and even better results.
William Wang
The engagement was highly productive, with Jackie delivering a fit-for-purpose solution that achieved strong outcomes within a tight timeframe.
Glass Tower
What a great group of people to work with. It's often hard to find value-for-money, responsive and straightforward partners in this space, so finding Max and Jackie has been a real relief. Simple Analytics has rescued our clunky old Power BI dashboards and turned them into genuinely useful and user friendly tools without pushing us into a whole rebuild. We would recommend them to other marketing and comms professionals looking to make the most of deeper data-driven insights.
Ajay Shankar
Have been working with Jackie for a few months and his work/insights has made a significant difference to our business. We’ve been able to identify gaps and trends with meaningful reporting available which has been pretty remarkable – but I’d always like to see more! Thank you Jackie for all the help!
Jeremy Wilson
We recently partnered with Simple Analytics and the experience was exceptional. The team were very knowledgeable with Power BI and truly understood the challenges faced by our business. They took their time to understand our business requirements and developed solutions that fit our needs. Their commitment to ensuring we got the most value out of our investment really stood out. The developed application and Power BI dashboards they implemented are easy to use, intuitive, and have become a key piece to our daily operations. We now have a much clearer view of our business - allowing us to make faster, smarter, and data-driven decisions.
Bring All Your Data
into One Place
Power BI enables organizations to connect to multiple data sources such as CRM, Financials, Google Analytics, and much more to give a 360-degree view of the Business. It provides users to interact with the data, self-serve, and collaborate.
Being a Microsoft product it integrates with other Microsoft products such as Teams for Collaboration Purposes, Powerpoint for live data presentions, Power Automate to run flows, and much more.
Unlock opportunities from your Data using Power BI.
Our Power BI Core Values
Keep it Simple
Make it interactive
Drive business goals
"Have been working with Jackie for a few months and his work/insights has made a significant difference to our business. We’ve been able to identify gaps and trends with meaningful reporting available which has been pretty remarkable – but I’d always like to see more! Thank you Jackie for all the help!"
Ajay Shankar
Capital & Asset Manager
-
Te Whatu Ora
Power BI Case Studies
Nationwide – Power BI Embedded & Microsoft Fabric Customer Portal Solution
See how we developed an external facing app using Microsoft fabric & Power BI embedded for Australia's leading waste management company
Life Insurance Semantic Model
PPS partnered with Simple Analytics to build a scalable semantic model, enabling consistent sales metrics, improved pipeline visibility, and a strong foundation for AI-driven insights.
Frequently Asked Questions
What is a BI Dashboard?
What are the benefits of a BI Dashboard?
What tools are used for creating BI dashboards?
Is Microsoft Power BI free?
How can I ensure my BI dashboard provides a good return on investment?