CONTENT
Design a Data model in Power BI
Learn data modeling to design efficient databases, ensure data integrity, and optimize performance for storage, retrieval, and analysis.


Saartje Ly
Data Engineering Intern
April 12, 2024
What is Data Modelling?
Data modeling is the process of designing the structure of a database or data system to support efficient storage, retrieval, and analysis of data. It involves defining the layout of the data, including tables, columns, relationships, and constraints, to ensure data integrity and maximize performance.
First, we need to format our data.
Click anywhere in your column to select that column.
Column tools will appear, and you will see a formatting section.

Decimals to percentages
1. Click the ‘%’ icon
Change the number on the right hand side (where it currently says Auto) to choose decimal places.
Numeric to currency
1. Click the ‘$’ icon
Date formats
1. Select the Format drop down and choose your desired format

Next, we need to make sure to break down large tables.
Skip this if you are working with smaller tables.
It’s important to break a large table down into two or multiple tables. A golden rule is that you should not have fact (numeric) and descriptive (character based) fields in the same tables. By breaking down your tables more efficiently, you will optimize the performance of your data set.
Open Power Query Editor by clicking on the Transform data button in the Home tab.
1. On the left hand bar, copy & paste the table you’d like to break down
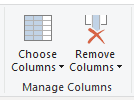
2. Select the copied table, then choose columns to keep by selecting Choose Columns in the Home tab
We need to make sure that we have a key field (also known as primary key). It is a unique identifier that makes each record unique. For example, customer ID.
If you don’t have a key field, let’s create one:
1. Go to the Add Column tab
2. Select the drop down from Index Column, and choose custom
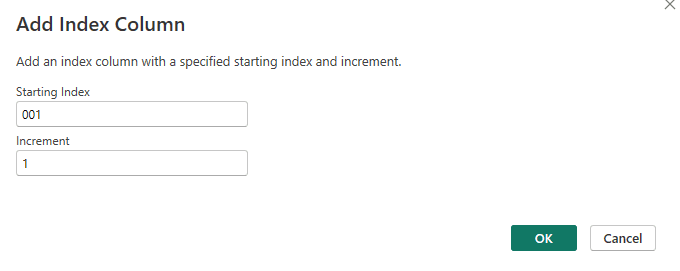
3. Fill the starting index and increment, then click OK
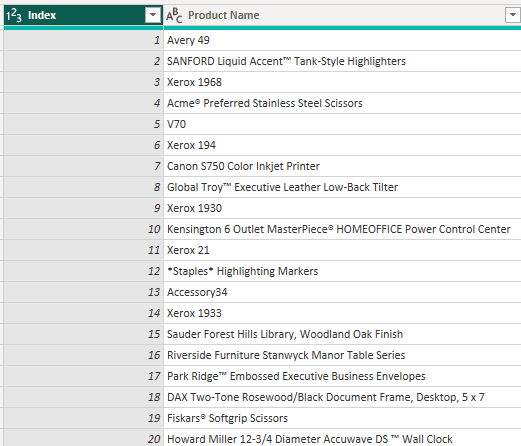
4. Click & drag this column to the front of the table
When you’re done in Power Query Editor, remember to click Close & Apply in the Home tab.
Creating a hierarchy based on a field in the table
A hierarchy is a way of grouping related fields together. We create hierarchies to use directly in visualizations, organize related columns into levels, present data in a structured and intuitive format, and explore the data through summaries. When you’re creating a hierarchy you want to start with the broadest category and end with the narrowest category.
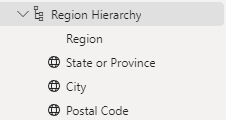
1. On the right hand bar right click on a category and select create hierarchy
This creates:
2. Find the columns next in the hierarchy, right click on them, select add to hierarchy.
Relationships/Cardinality
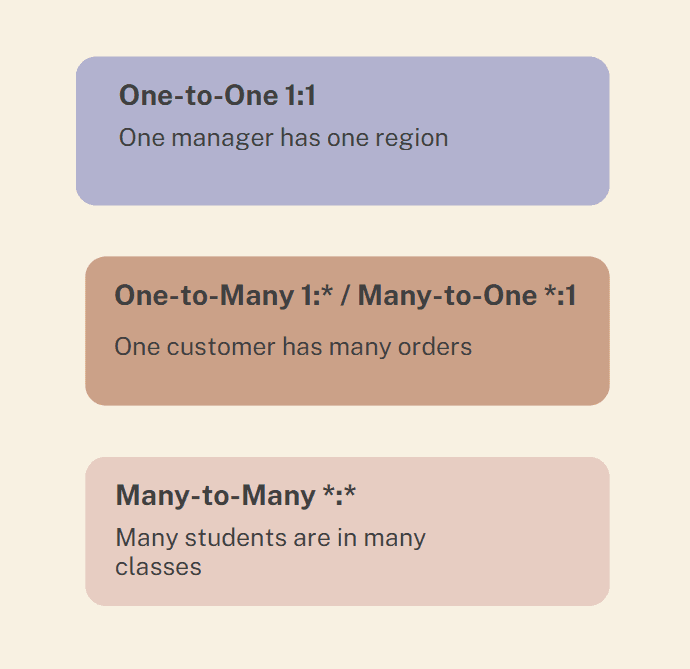
Click on the model view on the left hand bar.
Here, you can explore the types of relationships between the tables.
To create a relationship between two tables:
Make sure the same column is in both of the tables.
1. Click and drag the column of one table on top of the column of the other table.
Below, I dragged Order ID on top of Order ID in the Returns table. This created a Many to 1 relationship as you can see with the arrow.
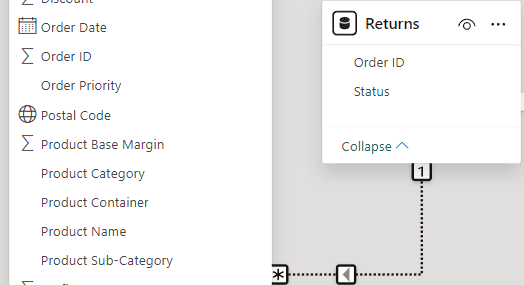
If you’d like to see details of the relationship, double click the join line in between the two tables.
Row-Level Security (RLS)
RLS in Power BI can be used to restrict data access for given users. Filters restrict data access at the row level, and you can define filters within roles. In the Power BI Service, members of a workspace have access to datasets in the workspace. RLS doesn’t restrict this data access. In Desktop, you set up security roles and in the service, you assign users to those roles.
1. Go to the Modelling tab
2. In the security group, click on Manage roles
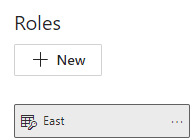
3. Click the New button in Roles

4. Double click your role to give it a name
5. In the Tables section, click on a table to let Power BI know you’re using a field from that table
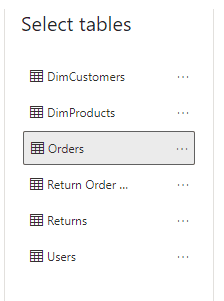
6. Filter the data. Choose your column, condition, and value.

Here we are saying only allow users assigned to the East role to see the Eastern region information from the Orders table.
Publishing
1. In the Home tab, click the Publish button.
2. Once you have chosen your workspace and published, you will see a pop up with a link starting with ‘Open…’
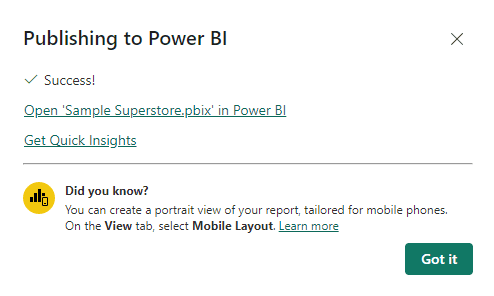
3. You can click this link to open the file in the cloud based service.
4. Inside the cloud, navigate to your workspace.
5. Hover over your dataset, click on the vertical ellipses, and click security.
Here, you can add people who belong to your roles.
What is Data Modelling?
Data modeling is the process of designing the structure of a database or data system to support efficient storage, retrieval, and analysis of data. It involves defining the layout of the data, including tables, columns, relationships, and constraints, to ensure data integrity and maximize performance.
First, we need to format our data.
Click anywhere in your column to select that column.
Column tools will appear, and you will see a formatting section.

Decimals to percentages
1. Click the ‘%’ icon
Change the number on the right hand side (where it currently says Auto) to choose decimal places.
Numeric to currency
1. Click the ‘$’ icon
Date formats
1. Select the Format drop down and choose your desired format

Next, we need to make sure to break down large tables.
Skip this if you are working with smaller tables.
It’s important to break a large table down into two or multiple tables. A golden rule is that you should not have fact (numeric) and descriptive (character based) fields in the same tables. By breaking down your tables more efficiently, you will optimize the performance of your data set.
Open Power Query Editor by clicking on the Transform data button in the Home tab.
1. On the left hand bar, copy & paste the table you’d like to break down
2. Select the copied table, then choose columns to keep by selecting Choose Columns in the Home tab

We need to make sure that we have a key field (also known as primary key). It is a unique identifier that makes each record unique. For example, customer ID.
If you don’t have a key field, let’s create one:
1. Go to the Add Column tab
2. Select the drop down from Index Column, and choose custom
3. Fill the starting index and increment, then click OK

4. Click & drag this column to the front of the table

When you’re done in Power Query Editor, remember to click Close & Apply in the Home tab.
Creating a hierarchy based on a field in the table
A hierarchy is a way of grouping related fields together. We create hierarchies to use directly in visualizations, organize related columns into levels, present data in a structured and intuitive format, and explore the data through summaries. When you’re creating a hierarchy you want to start with the broadest category and end with the narrowest category.
1. On the right hand bar right click on a category and select create hierarchy
This creates:
2. Find the columns next in the hierarchy, right click on them, select add to hierarchy.

Relationships/Cardinality

Click on the model view on the left hand bar.
Here, you can explore the types of relationships between the tables.
To create a relationship between two tables:
Make sure the same column is in both of the tables.
1. Click and drag the column of one table on top of the column of the other table.
Below, I dragged Order ID on top of Order ID in the Returns table. This created a Many to 1 relationship as you can see with the arrow.

If you’d like to see details of the relationship, double click the join line in between the two tables.
Row-Level Security (RLS)
RLS in Power BI can be used to restrict data access for given users. Filters restrict data access at the row level, and you can define filters within roles. In the Power BI Service, members of a workspace have access to datasets in the workspace. RLS doesn’t restrict this data access. In Desktop, you set up security roles and in the service, you assign users to those roles.
1. Go to the Modelling tab
2. In the security group, click on Manage roles
3. Click the New button in Roles

4. Double click your role to give it a name

5. In the Tables section, click on a table to let Power BI know you’re using a field from that table

6. Filter the data. Choose your column, condition, and value.

Here we are saying only allow users assigned to the East role to see the Eastern region information from the Orders table.
Publishing
1. In the Home tab, click the Publish button.
2. Once you have chosen your workspace and published, you will see a pop up with a link starting with ‘Open…’

3. You can click this link to open the file in the cloud based service.
4. Inside the cloud, navigate to your workspace.
5. Hover over your dataset, click on the vertical ellipses, and click security.
Here, you can add people who belong to your roles.
What is Data Modelling?
Data modeling is the process of designing the structure of a database or data system to support efficient storage, retrieval, and analysis of data. It involves defining the layout of the data, including tables, columns, relationships, and constraints, to ensure data integrity and maximize performance.
First, we need to format our data.
Click anywhere in your column to select that column.
Column tools will appear, and you will see a formatting section.

Decimals to percentages
1. Click the ‘%’ icon
Change the number on the right hand side (where it currently says Auto) to choose decimal places.
Numeric to currency
1. Click the ‘$’ icon
Date formats
1. Select the Format drop down and choose your desired format

Next, we need to make sure to break down large tables.
Skip this if you are working with smaller tables.
It’s important to break a large table down into two or multiple tables. A golden rule is that you should not have fact (numeric) and descriptive (character based) fields in the same tables. By breaking down your tables more efficiently, you will optimize the performance of your data set.
Open Power Query Editor by clicking on the Transform data button in the Home tab.
1. On the left hand bar, copy & paste the table you’d like to break down
2. Select the copied table, then choose columns to keep by selecting Choose Columns in the Home tab

We need to make sure that we have a key field (also known as primary key). It is a unique identifier that makes each record unique. For example, customer ID.
If you don’t have a key field, let’s create one:
1. Go to the Add Column tab
2. Select the drop down from Index Column, and choose custom
3. Fill the starting index and increment, then click OK

4. Click & drag this column to the front of the table

When you’re done in Power Query Editor, remember to click Close & Apply in the Home tab.
Creating a hierarchy based on a field in the table
A hierarchy is a way of grouping related fields together. We create hierarchies to use directly in visualizations, organize related columns into levels, present data in a structured and intuitive format, and explore the data through summaries. When you’re creating a hierarchy you want to start with the broadest category and end with the narrowest category.
1. On the right hand bar right click on a category and select create hierarchy
This creates:
2. Find the columns next in the hierarchy, right click on them, select add to hierarchy.

Relationships/Cardinality

Click on the model view on the left hand bar.
Here, you can explore the types of relationships between the tables.
To create a relationship between two tables:
Make sure the same column is in both of the tables.
1. Click and drag the column of one table on top of the column of the other table.
Below, I dragged Order ID on top of Order ID in the Returns table. This created a Many to 1 relationship as you can see with the arrow.

If you’d like to see details of the relationship, double click the join line in between the two tables.
Row-Level Security (RLS)
RLS in Power BI can be used to restrict data access for given users. Filters restrict data access at the row level, and you can define filters within roles. In the Power BI Service, members of a workspace have access to datasets in the workspace. RLS doesn’t restrict this data access. In Desktop, you set up security roles and in the service, you assign users to those roles.
1. Go to the Modelling tab
2. In the security group, click on Manage roles
3. Click the New button in Roles

4. Double click your role to give it a name

5. In the Tables section, click on a table to let Power BI know you’re using a field from that table

6. Filter the data. Choose your column, condition, and value.

Here we are saying only allow users assigned to the East role to see the Eastern region information from the Orders table.
Publishing
1. In the Home tab, click the Publish button.
2. Once you have chosen your workspace and published, you will see a pop up with a link starting with ‘Open…’

3. You can click this link to open the file in the cloud based service.
4. Inside the cloud, navigate to your workspace.
5. Hover over your dataset, click on the vertical ellipses, and click security.
Here, you can add people who belong to your roles.
CONTENT
SHARE