CONTENT
Power BI Slicers
Learn how to effectively use various slicers in Power BI to enhance your data filtering, visualization capabilities, and overall data analysis.


Saartje Ly
Data Engineering Intern
May 4, 2024
Button slicer
1. On a blank page add the slicer visual
2. Pick your category for your slicer by ticking the box in the right Data pane
The default slicer type for text is a list. Let’s now change it to look like buttons.
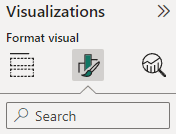
3. Go to formatting options in the Visualizations pane
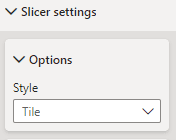
4. In the Slicer settings box under Options, change the Style from Vertical list to Tile.
Play around with the sizing of the buttons. If you want horizontal buttons, increase the width. If you want vertical buttons, increase the height.
5. If you would like the user to be able to choose multiple buttons at a time, leave them as is. If you would like the user to only choose one button at a time; Open the Selection box under Slicer settings, then turn on Single select.
6. If the buttons are self-explanatory, turn off the Slicer header button.
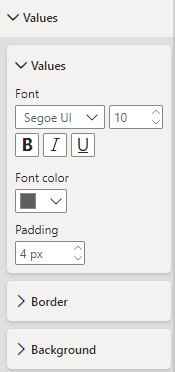
7. Adjust the look of the buttons under the Values box
List & hierarchy slicer
1. Add your slicer visualization, and add in your data.
Multi-select is turned on for the user. If you’d like to turn this off, navigate to format visual, and turn Single select on.
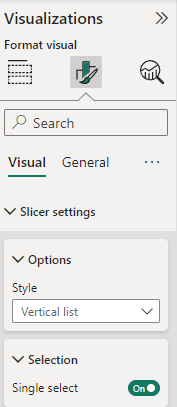
2. If you’d like to exclude something from your list, right click it, and choose exclude.
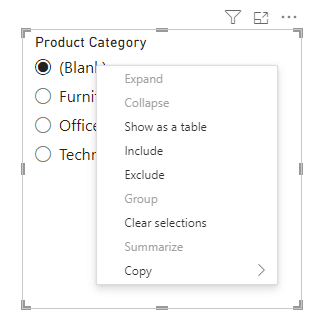
We can easily turn this into a hierarchy slicer even if we don’t have official hierarchies set up.
3. Choose another field, and drag and drop it into the field box in the Visualizations pane
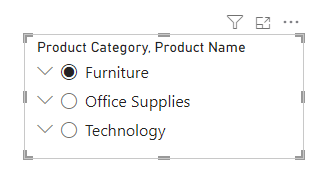
We are now able to ‘drill down’ into a product category to look at all the product names.
4. Change the levels indentation and expand/collapse icon in the Hierarchy dropdown inside Format visual

Drop-down slicer
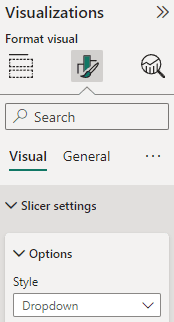
Change your list/hierarchy slicer to a drop-down slicer by changing the Style in Options under Slicer settings in Format visual.
Timeline slicer
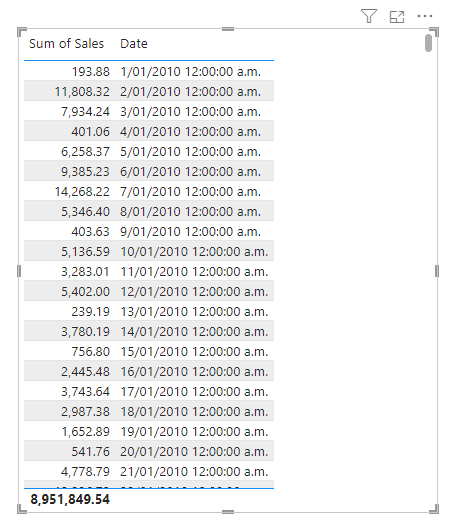
Start with a table of data
1. Add a slicer to your canvas
2. Add in data that you’d like to filter your table data by
I.e., we want to quickly look at sum of sales across a specific date range
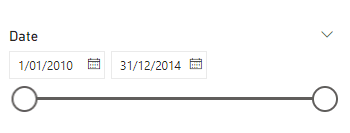
3. Change the style of the slicer under Options in Slicer settings
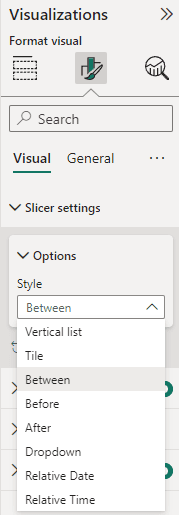
You can also make a numeric slicer by choosing numeric data instead of timeline data.
Syncing slicers across multiple pages
For example, we want a visualization to be filtered based on a slicer selection on a different page.
1. Select your slicer, then head to the View tab up the top
2. Click Sync slicers
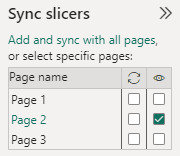
The two arrows represent a sync. We want to sync the slicer with its current page, and the page with the visualization on it. Tick the corresponding boxes.
The eye represents whether that slicer is visible on the page.
You can now use slicers and update your visualizations from different pages.
Button slicer
1. On a blank page add the slicer visual
2. Pick your category for your slicer by ticking the box in the right Data pane
The default slicer type for text is a list. Let’s now change it to look like buttons.
3. Go to formatting options in the Visualizations pane

4. In the Slicer settings box under Options, change the Style from Vertical list to Tile.

Play around with the sizing of the buttons. If you want horizontal buttons, increase the width. If you want vertical buttons, increase the height.
5. If you would like the user to be able to choose multiple buttons at a time, leave them as is. If you would like the user to only choose one button at a time; Open the Selection box under Slicer settings, then turn on Single select.
6. If the buttons are self-explanatory, turn off the Slicer header button.
7. Adjust the look of the buttons under the Values box

List & hierarchy slicer
1. Add your slicer visualization, and add in your data.
Multi-select is turned on for the user. If you’d like to turn this off, navigate to format visual, and turn Single select on.

2. If you’d like to exclude something from your list, right click it, and choose exclude.

We can easily turn this into a hierarchy slicer even if we don’t have official hierarchies set up.
3. Choose another field, and drag and drop it into the field box in the Visualizations pane

We are now able to ‘drill down’ into a product category to look at all the product names.
4. Change the levels indentation and expand/collapse icon in the Hierarchy dropdown inside Format visual

Drop-down slicer
Change your list/hierarchy slicer to a drop-down slicer by changing the Style in Options under Slicer settings in Format visual.

Timeline slicer
Start with a table of data

1. Add a slicer to your canvas
2. Add in data that you’d like to filter your table data by
I.e., we want to quickly look at sum of sales across a specific date range

3. Change the style of the slicer under Options in Slicer settings

You can also make a numeric slicer by choosing numeric data instead of timeline data.
Syncing slicers across multiple pages
For example, we want a visualization to be filtered based on a slicer selection on a different page.
1. Select your slicer, then head to the View tab up the top
2. Click Sync slicers

The two arrows represent a sync. We want to sync the slicer with its current page, and the page with the visualization on it. Tick the corresponding boxes.
The eye represents whether that slicer is visible on the page.
You can now use slicers and update your visualizations from different pages.
Button slicer
1. On a blank page add the slicer visual
2. Pick your category for your slicer by ticking the box in the right Data pane
The default slicer type for text is a list. Let’s now change it to look like buttons.
3. Go to formatting options in the Visualizations pane

4. In the Slicer settings box under Options, change the Style from Vertical list to Tile.

Play around with the sizing of the buttons. If you want horizontal buttons, increase the width. If you want vertical buttons, increase the height.
5. If you would like the user to be able to choose multiple buttons at a time, leave them as is. If you would like the user to only choose one button at a time; Open the Selection box under Slicer settings, then turn on Single select.
6. If the buttons are self-explanatory, turn off the Slicer header button.
7. Adjust the look of the buttons under the Values box

List & hierarchy slicer
1. Add your slicer visualization, and add in your data.
Multi-select is turned on for the user. If you’d like to turn this off, navigate to format visual, and turn Single select on.

2. If you’d like to exclude something from your list, right click it, and choose exclude.

We can easily turn this into a hierarchy slicer even if we don’t have official hierarchies set up.
3. Choose another field, and drag and drop it into the field box in the Visualizations pane

We are now able to ‘drill down’ into a product category to look at all the product names.
4. Change the levels indentation and expand/collapse icon in the Hierarchy dropdown inside Format visual

Drop-down slicer
Change your list/hierarchy slicer to a drop-down slicer by changing the Style in Options under Slicer settings in Format visual.

Timeline slicer
Start with a table of data

1. Add a slicer to your canvas
2. Add in data that you’d like to filter your table data by
I.e., we want to quickly look at sum of sales across a specific date range

3. Change the style of the slicer under Options in Slicer settings

You can also make a numeric slicer by choosing numeric data instead of timeline data.
Syncing slicers across multiple pages
For example, we want a visualization to be filtered based on a slicer selection on a different page.
1. Select your slicer, then head to the View tab up the top
2. Click Sync slicers

The two arrows represent a sync. We want to sync the slicer with its current page, and the page with the visualization on it. Tick the corresponding boxes.
The eye represents whether that slicer is visible on the page.
You can now use slicers and update your visualizations from different pages.
CONTENT
SHARE