CONTENT
Accessibility in Power BI
Explore Power BI's accessibility features, including built-in options like keyboard navigation and high contrast view, and configurable options such as alt text and tab order.


Saartje Ly
Data Engineering Intern
April 21, 2024
Introduction
There are two main categories of accessibility features in Power BI.
Built-in accessibility features requiring no configuration, and built-in accessibility features requiring configuration.
No configuration required
Keyboard navigation
Screen-reader compatibility
High contrast colours view
Focus mode
Show data table
Configuration required
Alt text
Tab order
Titles & labels
Markers
Report themes
Configuring alt text
If you don’t add Alt text, the screen reader will give a generic description of whatever is selected.
To edit Alt text:
1. Select your chart
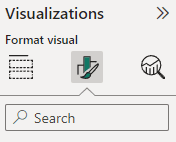
2. Navigate to Format visual in the Visualizations pane to the right

3. Click on the General tab
4. Find Alt text, and open the box
5. Edit the Alt text
Showing a data table for a visualization
A data table shows the underlying data in a table format that’s causing the visualization to be drawn.
1. Select your chart
2. Use the keyboard combination alt + shift + F11

Focus mode
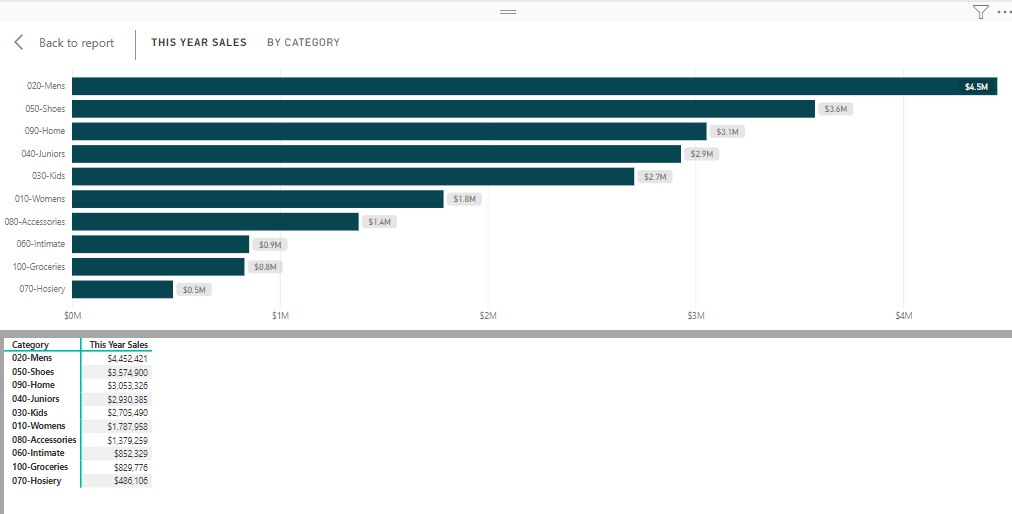
On the upper right hand corner of your chart, click on the middle button
This will focus in on your visualization which will fill up the screen
Tab order
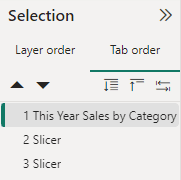
The order of what is selected in your canvas when you press the tab button.
1. Navigate to the View tab
2. Click on Selection in Show panes
3. Change your tab order as desired in the Selection pane to the right

Report themes
Access the different report themes under the View tab
Introduction
There are two main categories of accessibility features in Power BI.
Built-in accessibility features requiring no configuration, and built-in accessibility features requiring configuration.
No configuration required
Keyboard navigation
Screen-reader compatibility
High contrast colours view
Focus mode
Show data table
Configuration required
Alt text
Tab order
Titles & labels
Markers
Report themes
Configuring alt text
If you don’t add Alt text, the screen reader will give a generic description of whatever is selected.
To edit Alt text:
1. Select your chart
2. Navigate to Format visual in the Visualizations pane to the right

3. Click on the General tab
4. Find Alt text, and open the box
5. Edit the Alt text
Showing a data table for a visualization
A data table shows the underlying data in a table format that’s causing the visualization to be drawn.
1. Select your chart
2. Use the keyboard combination alt + shift + F11

Focus mode
On the upper right hand corner of your chart, click on the middle button
This will focus in on your visualization which will fill up the screen
Tab order
The order of what is selected in your canvas when you press the tab button.
1. Navigate to the View tab
2. Click on Selection in Show panes
3. Change your tab order as desired in the Selection pane to the right

Report themes
Access the different report themes under the View tab
Introduction
There are two main categories of accessibility features in Power BI.
Built-in accessibility features requiring no configuration, and built-in accessibility features requiring configuration.
No configuration required
Keyboard navigation
Screen-reader compatibility
High contrast colours view
Focus mode
Show data table
Configuration required
Alt text
Tab order
Titles & labels
Markers
Report themes
Configuring alt text
If you don’t add Alt text, the screen reader will give a generic description of whatever is selected.
To edit Alt text:
1. Select your chart
2. Navigate to Format visual in the Visualizations pane to the right

3. Click on the General tab
4. Find Alt text, and open the box
5. Edit the Alt text
Showing a data table for a visualization
A data table shows the underlying data in a table format that’s causing the visualization to be drawn.
1. Select your chart
2. Use the keyboard combination alt + shift + F11

Focus mode
On the upper right hand corner of your chart, click on the middle button
This will focus in on your visualization which will fill up the screen
Tab order
The order of what is selected in your canvas when you press the tab button.
1. Navigate to the View tab
2. Click on Selection in Show panes
3. Change your tab order as desired in the Selection pane to the right

Report themes
Access the different report themes under the View tab
CONTENT
SHARE