CONTENT
Learn DAX fundamentals in Power BI
Learn to solve common questions using DAX in Power BI, from calculating total revenue to categorizing columns.


Saartje Ly
Data Engineering Intern
July 23, 2024
Today I will go through a series of common questions that can be solved using DAX.
Make sure you have Power BI open, and have fun.
What is our total revenue?
1. In the Home tab, click on New measure and rename it Total Revenue
2. Equal it to the SUM of your revenue column and hit enter
This creates a new measure in the Data pane.
3. You'll notice that a number doesn't show up, the next step is to click on a matrix in visualizations, then drag and drop the total revenue column to this matrix.
Incase you want to edit the formula, you can simply click on the Total Revenue column again in the Data pane
How many unique brands do we sell?
1. In the Home tab, click on New measure and rename it Unique Brands
2. Use the DISTINCTCOUNT function with your brand column
If you'd like to add some commentary, do shift + enter to add another row, then forward dash twice (//) with your comment.
Hit enter.
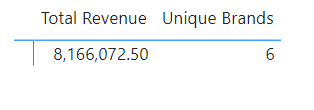
3. Drag the Unique Brands column from the Data pane to your matrix

Let's calculate our total profit!
(Revenue - Expenses)
1. In the Home tab, click on New measure and rename it Profit
2. Equal it to the SUM of the revenue minus the SUM of the expenses
3. Drag and drop it to the matrix

Let's calculate the profit margin!
Once we have the profit and the revenue, we can calculate the profit margin. This is the profit divided by the revenue.
1. In the Home tab, click on New measure and rename it Profit Margin %.
You might think of doing one divided by the other, however there will be an issue if the denominator is a 0. We can use the divide function to work around this.
2. The third argument in the DIVIDE function is for when there is an error. If you leave it blank, it won't put anything down which is good by us.
3. Drag and drop Profit Margin % into the matrix
So far we've been looking at Measures, but there's also something called Calculated Columns. These make sense if you want to evaluate each row as opposed to finding the total which is what we've been doing so far with measures.
Can you merge two columns?
1. Head to Table view on the left
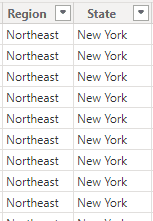
2. Let's say we wanted to merge Region and State into one column. Create a new column, and name it Region and State.

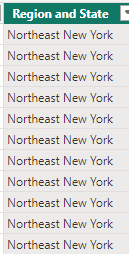
3. Type this DAX below (with your appropriate Data name). The '&' is to link things together. The " " space is so that we have a space between the region and the state.

Categorizing a numeric column into small or large sizes
Let's suppose we want to categorize our column Units Sold into small or large sizes based on the units sold.
if < 5000 = small, if > 5000 = large.
1. Create a new column again, and name it Category
2. Use the IF function. If units sold is less than 5000 then "Small", else it will be "Large".
But what if we wanted 3 categories? Small, Medium, Large?
Put an IF inside of the IF.
Here we say if it's above 5000, check if it's below 10000. If so, it's "Medium", else it's "Large".
Calculating the revenue for a specific brand
Let's say we wanted to calculate the revenue specifically for Sprite.
1. Go back to the report view in the left pane
2. Create a new measure, and name it Sprite Revenue
3. Equal it to the CALCULATE function and follow this layout
The first argument for this function is an expression, and the second argument is a filter.
4. Drag and drop it onto the matrix
Calculating the revenue for two brands
What if we wanted to see the revenue for two brands, let's say Sprite and Fanta?
1. Click on your Sprite Revenue column to the right
2. Update the name to Sprite and Fanta Revenue
3. Change the expression to below.
Here, the OR function will filter the CALCULATE function to Sprite, but if it isn't Sprite it will filter to Fanta.
Notice that the number in the matrix has changed.
Today I will go through a series of common questions that can be solved using DAX.
Make sure you have Power BI open, and have fun.
What is our total revenue?
1. In the Home tab, click on New measure and rename it Total Revenue
2. Equal it to the SUM of your revenue column and hit enter
This creates a new measure in the Data pane.
3. You'll notice that a number doesn't show up, the next step is to click on a matrix in visualizations, then drag and drop the total revenue column to this matrix.
Incase you want to edit the formula, you can simply click on the Total Revenue column again in the Data pane
How many unique brands do we sell?
1. In the Home tab, click on New measure and rename it Unique Brands
2. Use the DISTINCTCOUNT function with your brand column
If you'd like to add some commentary, do shift + enter to add another row, then forward dash twice (//) with your comment.
Hit enter.
3. Drag the Unique Brands column from the Data pane to your matrix

Let's calculate our total profit!
(Revenue - Expenses)
1. In the Home tab, click on New measure and rename it Profit
2. Equal it to the SUM of the revenue minus the SUM of the expenses
3. Drag and drop it to the matrix

Let's calculate the profit margin!
Once we have the profit and the revenue, we can calculate the profit margin. This is the profit divided by the revenue.
1. In the Home tab, click on New measure and rename it Profit Margin %.
You might think of doing one divided by the other, however there will be an issue if the denominator is a 0. We can use the divide function to work around this.
2. The third argument in the DIVIDE function is for when there is an error. If you leave it blank, it won't put anything down which is good by us.
3. Drag and drop Profit Margin % into the matrix
So far we've been looking at Measures, but there's also something called Calculated Columns. These make sense if you want to evaluate each row as opposed to finding the total which is what we've been doing so far with measures.
Can you merge two columns?
1. Head to Table view on the left
2. Let's say we wanted to merge Region and State into one column. Create a new column, and name it Region and State.

3. Type this DAX below (with your appropriate Data name). The '&' is to link things together. The " " space is so that we have a space between the region and the state.

Categorizing a numeric column into small or large sizes
Let's suppose we want to categorize our column Units Sold into small or large sizes based on the units sold.
if < 5000 = small, if > 5000 = large.
1. Create a new column again, and name it Category
2. Use the IF function. If units sold is less than 5000 then "Small", else it will be "Large".
But what if we wanted 3 categories? Small, Medium, Large?
Put an IF inside of the IF.
Here we say if it's above 5000, check if it's below 10000. If so, it's "Medium", else it's "Large".
Calculating the revenue for a specific brand
Let's say we wanted to calculate the revenue specifically for Sprite.
1. Go back to the report view in the left pane
2. Create a new measure, and name it Sprite Revenue
3. Equal it to the CALCULATE function and follow this layout
The first argument for this function is an expression, and the second argument is a filter.
4. Drag and drop it onto the matrix
Calculating the revenue for two brands
What if we wanted to see the revenue for two brands, let's say Sprite and Fanta?
1. Click on your Sprite Revenue column to the right
2. Update the name to Sprite and Fanta Revenue
3. Change the expression to below.
Here, the OR function will filter the CALCULATE function to Sprite, but if it isn't Sprite it will filter to Fanta.
Notice that the number in the matrix has changed.
Today I will go through a series of common questions that can be solved using DAX.
Make sure you have Power BI open, and have fun.
What is our total revenue?
1. In the Home tab, click on New measure and rename it Total Revenue
2. Equal it to the SUM of your revenue column and hit enter
This creates a new measure in the Data pane.
3. You'll notice that a number doesn't show up, the next step is to click on a matrix in visualizations, then drag and drop the total revenue column to this matrix.
Incase you want to edit the formula, you can simply click on the Total Revenue column again in the Data pane
How many unique brands do we sell?
1. In the Home tab, click on New measure and rename it Unique Brands
2. Use the DISTINCTCOUNT function with your brand column
If you'd like to add some commentary, do shift + enter to add another row, then forward dash twice (//) with your comment.
Hit enter.
3. Drag the Unique Brands column from the Data pane to your matrix

Let's calculate our total profit!
(Revenue - Expenses)
1. In the Home tab, click on New measure and rename it Profit
2. Equal it to the SUM of the revenue minus the SUM of the expenses
3. Drag and drop it to the matrix

Let's calculate the profit margin!
Once we have the profit and the revenue, we can calculate the profit margin. This is the profit divided by the revenue.
1. In the Home tab, click on New measure and rename it Profit Margin %.
You might think of doing one divided by the other, however there will be an issue if the denominator is a 0. We can use the divide function to work around this.
2. The third argument in the DIVIDE function is for when there is an error. If you leave it blank, it won't put anything down which is good by us.
3. Drag and drop Profit Margin % into the matrix
So far we've been looking at Measures, but there's also something called Calculated Columns. These make sense if you want to evaluate each row as opposed to finding the total which is what we've been doing so far with measures.
Can you merge two columns?
1. Head to Table view on the left
2. Let's say we wanted to merge Region and State into one column. Create a new column, and name it Region and State.

3. Type this DAX below (with your appropriate Data name). The '&' is to link things together. The " " space is so that we have a space between the region and the state.

Categorizing a numeric column into small or large sizes
Let's suppose we want to categorize our column Units Sold into small or large sizes based on the units sold.
if < 5000 = small, if > 5000 = large.
1. Create a new column again, and name it Category
2. Use the IF function. If units sold is less than 5000 then "Small", else it will be "Large".
But what if we wanted 3 categories? Small, Medium, Large?
Put an IF inside of the IF.
Here we say if it's above 5000, check if it's below 10000. If so, it's "Medium", else it's "Large".
Calculating the revenue for a specific brand
Let's say we wanted to calculate the revenue specifically for Sprite.
1. Go back to the report view in the left pane
2. Create a new measure, and name it Sprite Revenue
3. Equal it to the CALCULATE function and follow this layout
The first argument for this function is an expression, and the second argument is a filter.
4. Drag and drop it onto the matrix
Calculating the revenue for two brands
What if we wanted to see the revenue for two brands, let's say Sprite and Fanta?
1. Click on your Sprite Revenue column to the right
2. Update the name to Sprite and Fanta Revenue
3. Change the expression to below.
Here, the OR function will filter the CALCULATE function to Sprite, but if it isn't Sprite it will filter to Fanta.
Notice that the number in the matrix has changed.
CONTENT
SHARE