CONTENT
Tableau: adding value to analysis - trends, distributions, and forecasting
Learn how to create trend lines, distribution bands, and five-year sales forecasts using Tableau's Sample Superstore Workbook.


Saartje Ly
Data Engineering Intern
July 9, 2024
Start off in the Sample Superstore Workbook.
Trends
Create a new sheet, putting Quantity in Columns and Sales in Rows. Make sure that Quantity is continuous by clicking on its dropdown arrow and changing it.
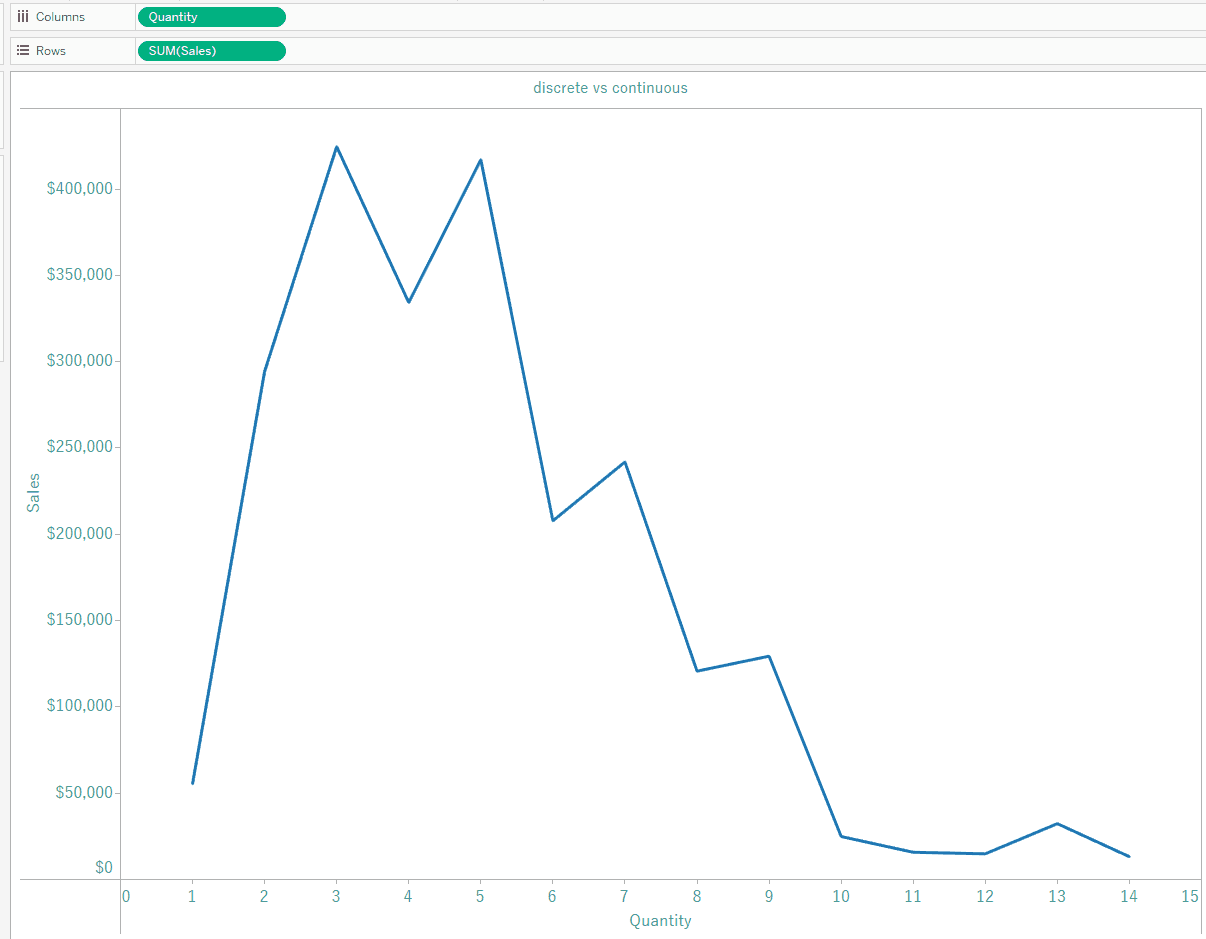
Change the title to say "Sales by Quantity"
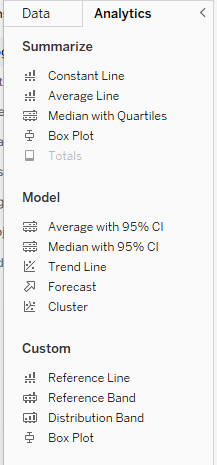
Head to the analytics tab to the left, then click and drag Trend Line onto the canvas. Drop it on Linear.
Right click on your trend line and go to Format.
If you want a different trend line type, here is the place to change it.
Distribution Bands
Go ahead and create a new sheet. Drag Ship Mode and Ship Date to Columns. Right click on Ship Date, hover over more, and choose Weekday. Then, drag Orders(count) to the Rows shelf.
On the Marks card change the Automatic dropdown to Bar.
Edit the title to "Count of Orders by Ship Mode by Day of Week", and click the Color box in the Marks card to change the bar colour.
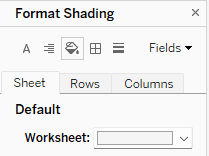
Right click anywhere on the plot, click Format, head to the colour bucket up the top, and change the Worksheet colour to light grey.
Name the sheet tab "Distribution Band", then go to the Analytics pane on the left. Under Custom, grab the Distribution Band and drop it on Pane (we're going to do a distribution band for each pane).
Where it says Computation, open the Value dropdown, and select Percentiles. To the right for the Percentiles dropdown, select Enter One or More Values, and type in 25,50,75. Click OK.
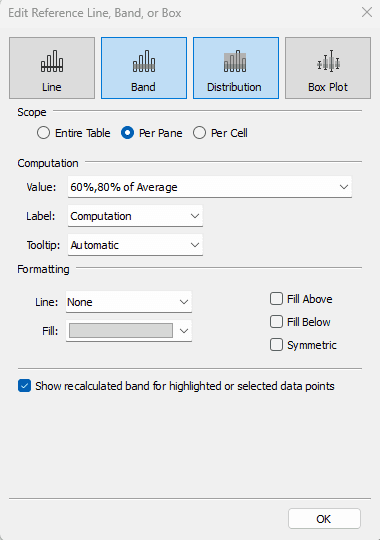
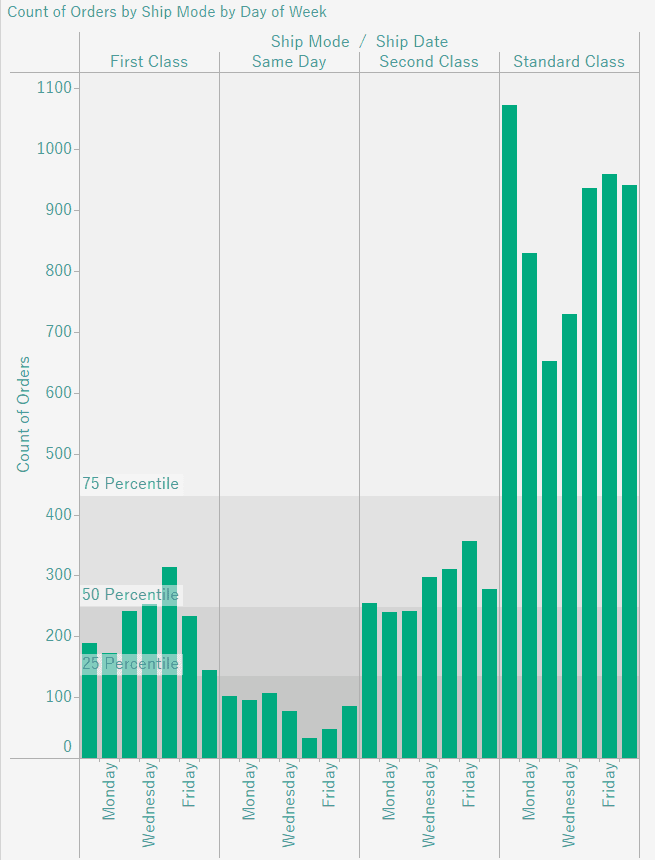
Now we see the distributions across the panes.
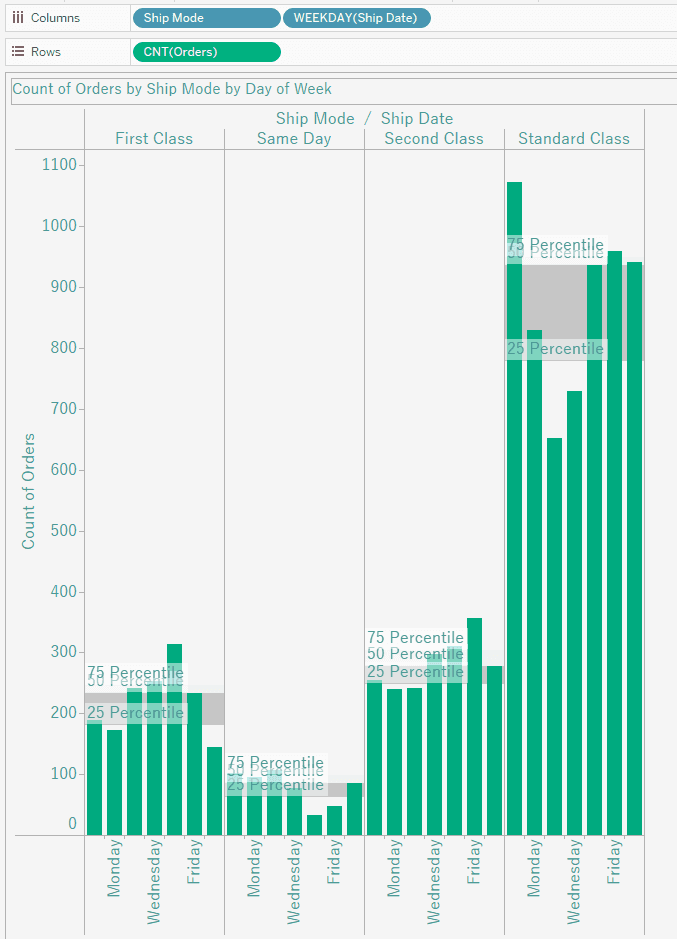
If we hover over a distribution band in a pane, we will get different values compared to other panes. If we want to look at the table level what we can do is right click on any of the bands and choose edit, then at the top choose Entire Table.
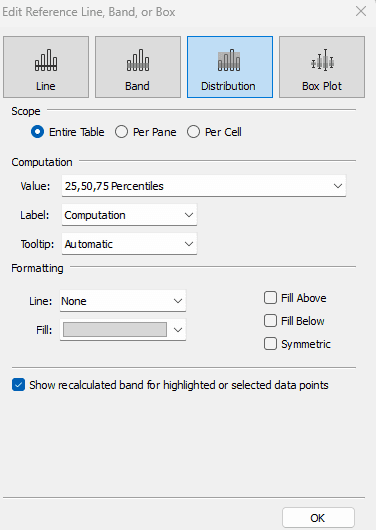
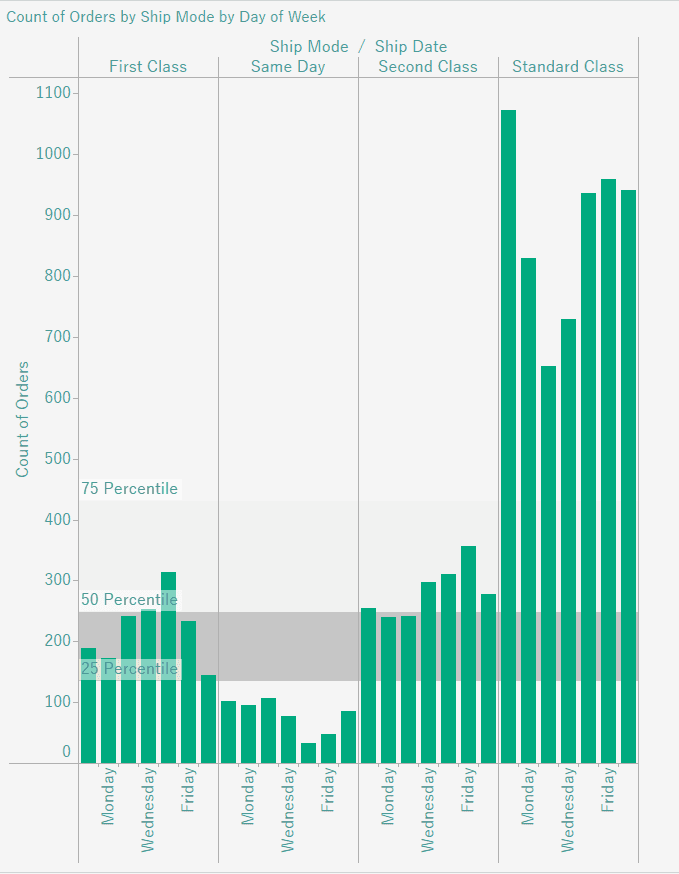
Let's Edit it again. Click Fill Above and Fill Below in Formatting.

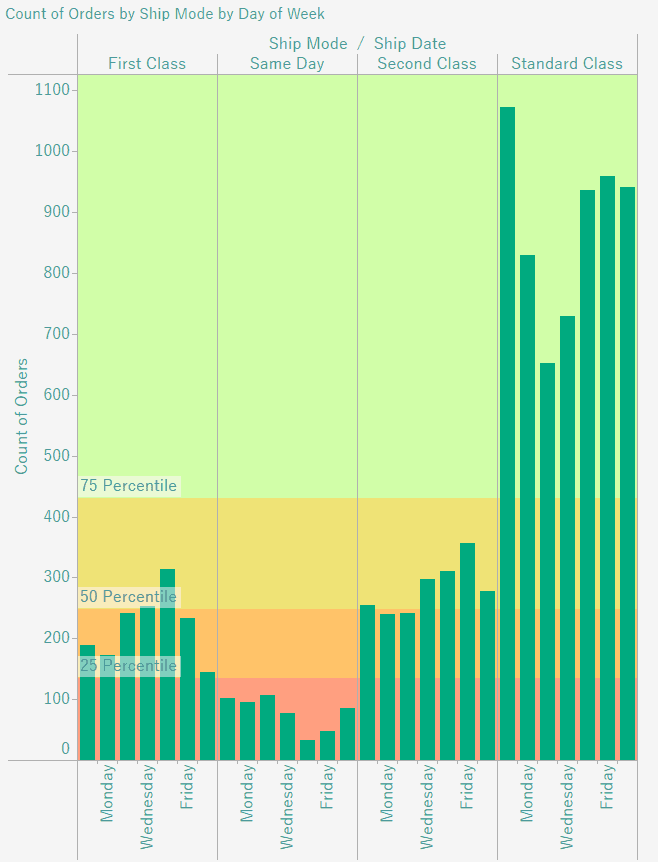
Click a distribution band and click Format to change it's colour in the Fill dropdown.
Forecasting
Let's go ahead and create a new sheet and name it "Forecasting".
Drag Order Date to Columns, and Sales to Rows.
Up the top where it says Standard, change the dropdown to Entire View.
Click on Color in the Marks card to change the colour of the line. Then go to the Label box, tick Show mark labels, and in the Font dropdown select Bold.
Right click on the plot, choose Forecast > Show Forecast.
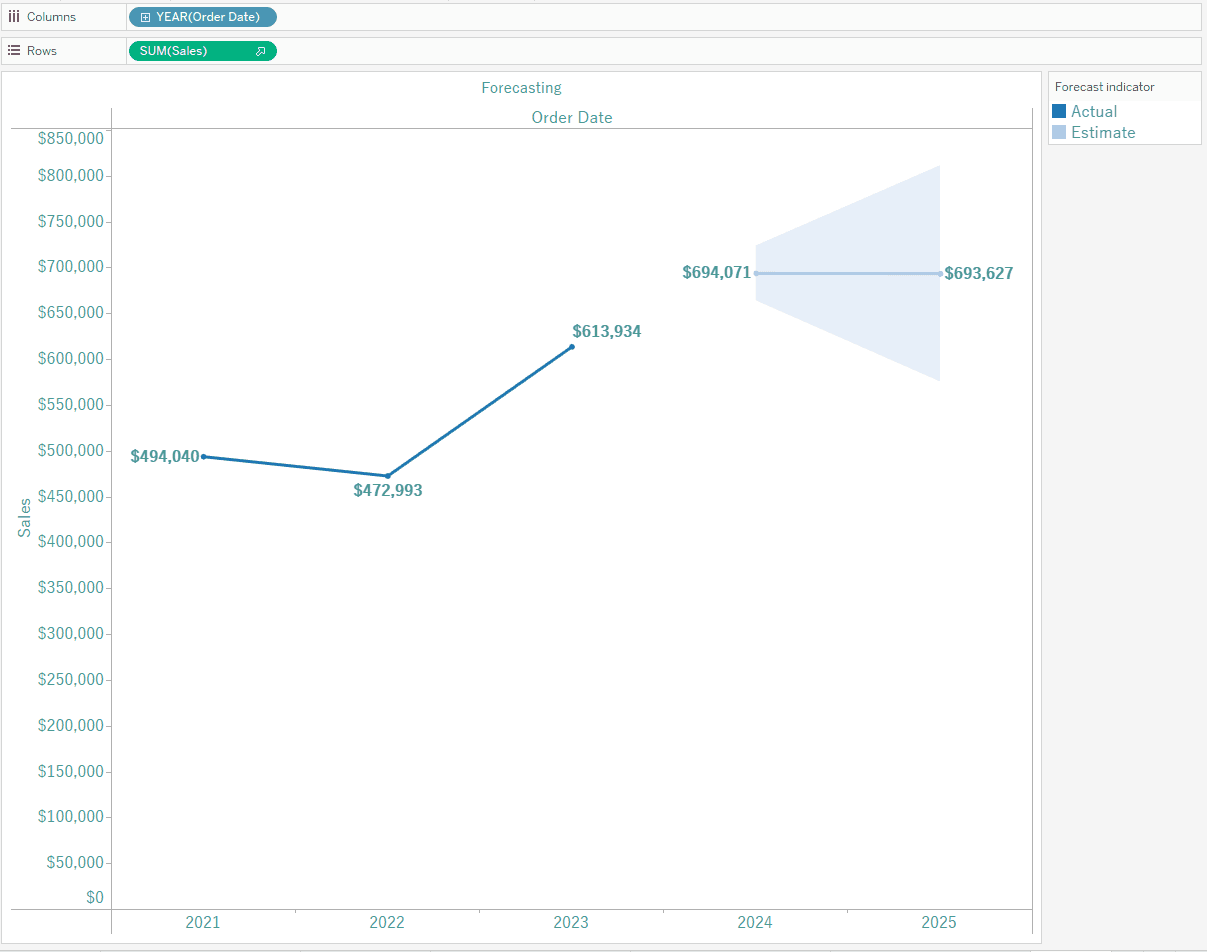
To the right you'll see the Forecast Indicator.
Right click on Order Date in the Columns Shelf, and make it a continuous field.
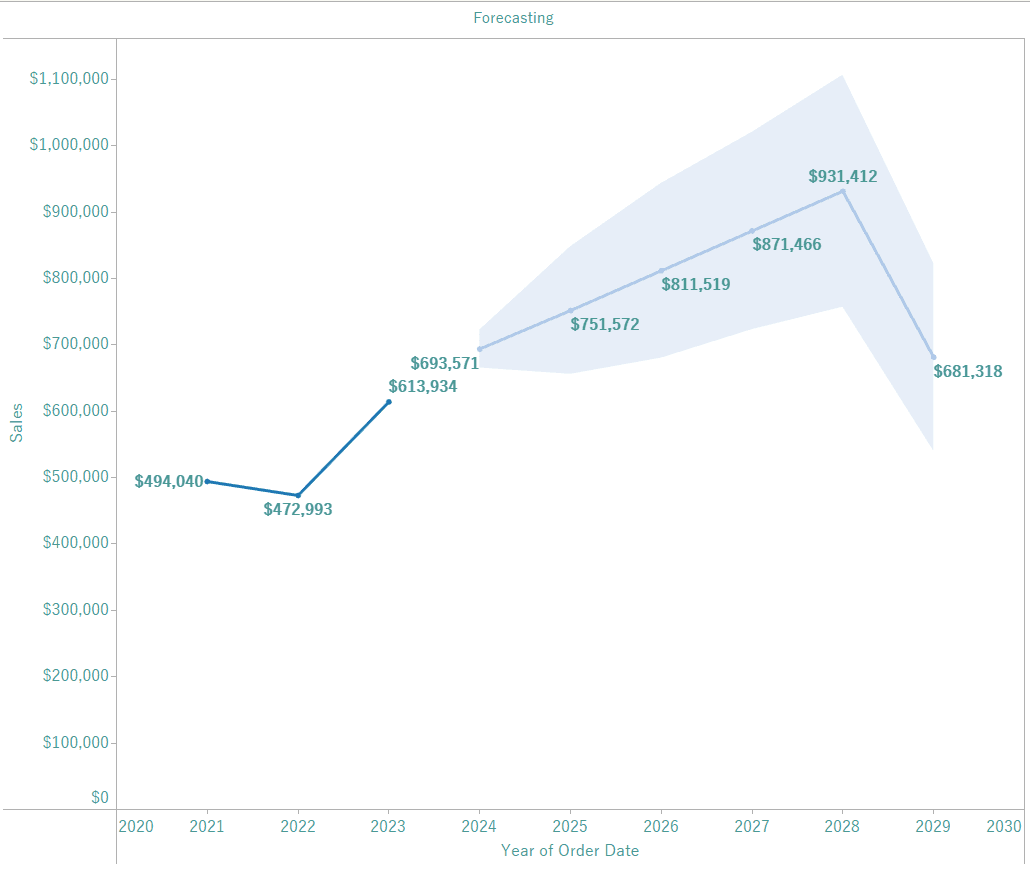
If you hover over your forecast you'll see that we're given two years of a forecast for 2024 and 2025. Let's change that. Right click on the forecast, hover over Forecast, and click Forecast Options. Change the option to Exactly, and make it 5 Years.
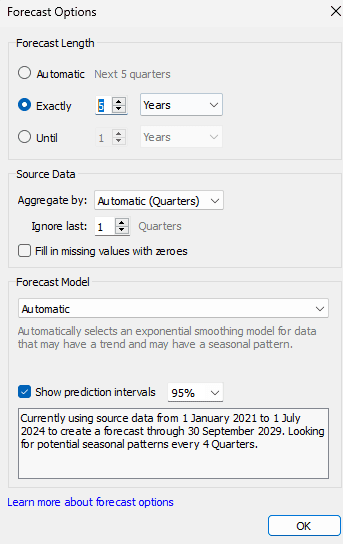
By default it's ignoring the last quarter in Ignore last. This means it doesn't take into account the last quarter of data when forecasting (it may not be good data).
In Forecast Model we can choose Custom. Set the Trend and Season to Additive.
Underneath that you'll see Show prediction interval at 95%. This means the forecast model has determined with 95% probability that estimated values of the measurement will fall within that area for that given period. Click OK.
Right click on our Forecast again, hover over Forecast, and this time choose Describe Forecast.
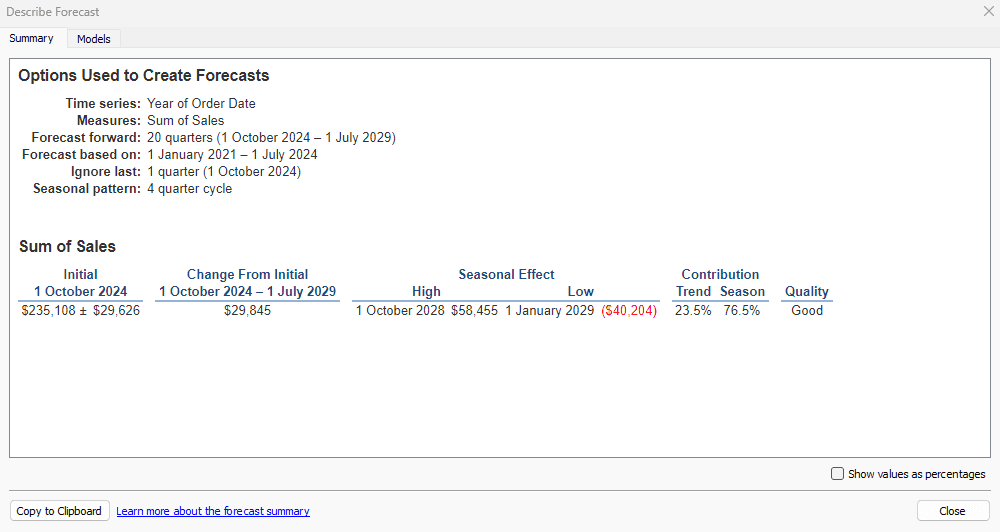
On the lower right hand corner you can choose to Show values as percentages.
There's also a Models tab with more information.
Edit the title to say "5 Years Sales Forecast". Remember to save your workbook :).
Start off in the Sample Superstore Workbook.

Trends
Create a new sheet, putting Quantity in Columns and Sales in Rows. Make sure that Quantity is continuous by clicking on its dropdown arrow and changing it.

Change the title to say "Sales by Quantity"
Head to the analytics tab to the left, then click and drag Trend Line onto the canvas. Drop it on Linear.

Right click on your trend line and go to Format.
If you want a different trend line type, here is the place to change it.
Distribution Bands
Go ahead and create a new sheet. Drag Ship Mode and Ship Date to Columns. Right click on Ship Date, hover over more, and choose Weekday. Then, drag Orders(count) to the Rows shelf.
On the Marks card change the Automatic dropdown to Bar.
Edit the title to "Count of Orders by Ship Mode by Day of Week", and click the Color box in the Marks card to change the bar colour.
Right click anywhere on the plot, click Format, head to the colour bucket up the top, and change the Worksheet colour to light grey.

Name the sheet tab "Distribution Band", then go to the Analytics pane on the left. Under Custom, grab the Distribution Band and drop it on Pane (we're going to do a distribution band for each pane).
Where it says Computation, open the Value dropdown, and select Percentiles. To the right for the Percentiles dropdown, select Enter One or More Values, and type in 25,50,75. Click OK.

Now we see the distributions across the panes.

If we hover over a distribution band in a pane, we will get different values compared to other panes. If we want to look at the table level what we can do is right click on any of the bands and choose edit, then at the top choose Entire Table.


Let's Edit it again. Click Fill Above and Fill Below in Formatting.


Click a distribution band and click Format to change it's colour in the Fill dropdown.

Forecasting
Let's go ahead and create a new sheet and name it "Forecasting".
Drag Order Date to Columns, and Sales to Rows.
Up the top where it says Standard, change the dropdown to Entire View.
Click on Color in the Marks card to change the colour of the line. Then go to the Label box, tick Show mark labels, and in the Font dropdown select Bold.
Right click on the plot, choose Forecast > Show Forecast.

To the right you'll see the Forecast Indicator.
Right click on Order Date in the Columns Shelf, and make it a continuous field.
If you hover over your forecast you'll see that we're given two years of a forecast for 2024 and 2025. Let's change that. Right click on the forecast, hover over Forecast, and click Forecast Options. Change the option to Exactly, and make it 5 Years.

By default it's ignoring the last quarter in Ignore last. This means it doesn't take into account the last quarter of data when forecasting (it may not be good data).
In Forecast Model we can choose Custom. Set the Trend and Season to Additive.
Underneath that you'll see Show prediction interval at 95%. This means the forecast model has determined with 95% probability that estimated values of the measurement will fall within that area for that given period. Click OK.

Right click on our Forecast again, hover over Forecast, and this time choose Describe Forecast.

On the lower right hand corner you can choose to Show values as percentages.
There's also a Models tab with more information.
Edit the title to say "5 Years Sales Forecast". Remember to save your workbook :).
Start off in the Sample Superstore Workbook.

Trends
Create a new sheet, putting Quantity in Columns and Sales in Rows. Make sure that Quantity is continuous by clicking on its dropdown arrow and changing it.

Change the title to say "Sales by Quantity"
Head to the analytics tab to the left, then click and drag Trend Line onto the canvas. Drop it on Linear.

Right click on your trend line and go to Format.
If you want a different trend line type, here is the place to change it.
Distribution Bands
Go ahead and create a new sheet. Drag Ship Mode and Ship Date to Columns. Right click on Ship Date, hover over more, and choose Weekday. Then, drag Orders(count) to the Rows shelf.
On the Marks card change the Automatic dropdown to Bar.
Edit the title to "Count of Orders by Ship Mode by Day of Week", and click the Color box in the Marks card to change the bar colour.
Right click anywhere on the plot, click Format, head to the colour bucket up the top, and change the Worksheet colour to light grey.

Name the sheet tab "Distribution Band", then go to the Analytics pane on the left. Under Custom, grab the Distribution Band and drop it on Pane (we're going to do a distribution band for each pane).
Where it says Computation, open the Value dropdown, and select Percentiles. To the right for the Percentiles dropdown, select Enter One or More Values, and type in 25,50,75. Click OK.

Now we see the distributions across the panes.

If we hover over a distribution band in a pane, we will get different values compared to other panes. If we want to look at the table level what we can do is right click on any of the bands and choose edit, then at the top choose Entire Table.


Let's Edit it again. Click Fill Above and Fill Below in Formatting.


Click a distribution band and click Format to change it's colour in the Fill dropdown.

Forecasting
Let's go ahead and create a new sheet and name it "Forecasting".
Drag Order Date to Columns, and Sales to Rows.
Up the top where it says Standard, change the dropdown to Entire View.
Click on Color in the Marks card to change the colour of the line. Then go to the Label box, tick Show mark labels, and in the Font dropdown select Bold.
Right click on the plot, choose Forecast > Show Forecast.

To the right you'll see the Forecast Indicator.
Right click on Order Date in the Columns Shelf, and make it a continuous field.
If you hover over your forecast you'll see that we're given two years of a forecast for 2024 and 2025. Let's change that. Right click on the forecast, hover over Forecast, and click Forecast Options. Change the option to Exactly, and make it 5 Years.

By default it's ignoring the last quarter in Ignore last. This means it doesn't take into account the last quarter of data when forecasting (it may not be good data).
In Forecast Model we can choose Custom. Set the Trend and Season to Additive.
Underneath that you'll see Show prediction interval at 95%. This means the forecast model has determined with 95% probability that estimated values of the measurement will fall within that area for that given period. Click OK.

Right click on our Forecast again, hover over Forecast, and this time choose Describe Forecast.

On the lower right hand corner you can choose to Show values as percentages.
There's also a Models tab with more information.
Edit the title to say "5 Years Sales Forecast". Remember to save your workbook :).
CONTENT
SHARE