CONTENT
Model calculations using DAX in Power BI
DAX in Power BI uses functions and operators to create calculated tables, columns, and measures for dynamic data analysis.


Saartje Ly
Data Engineering Intern
What is DAX?
DAX stands for Data Analysis Expressions and is the formula language used in Power BI.
DAX is a collection of functions, operators, and constants that can be used in a formula, or expression, to calculate and return one or more values.
DAX context enables you to perform dynamic analysis, in which the results of a formula can change to reflect the current row or cell selection and any related data.
Creating calculated tables
We will start by using the DISTINCT function in DAX to create a calculated table that returns a column of distinct values of another column from another table.
1. Head to the Modelling tab
2. Select New Table in Calculations
A top bar should appear with the text ‘Table = ‘
3. Rename this table
4. Type in your DAX, where we have the name of the table with the column of the table enclosed in square brackets inside DISTINCT(). Hit Enter.
5. Go to Table View
6. On the right hand Data panel, select your table you just created to view.

Creating calculated columns
There are two ways to create a calculated column in Power BI. The first is using the DATEDIFF function, and the second is using the Column tools tab.
Using the DATEDIFF function to calculate the difference in days between two date columns in a table
1. In Table View, in the Data panel to the right, right click on the table of choice and select New Column
A formula bar will appear at the top
2. Rename this column
3. Create your DAX expression, then hit enter.
The first argument represents the first column, the second argument represents the second column, and the third argument represents the interval we want the difference of dates in.
We want it to assess the entire date, so we use .[Date]
4. Scroll to the right in your table, the new column will be at the end.
Creating a calculated column using the Column tools tab that shows a ranking of a column. I.e, the highest value of that column will have a ranking of 1. We will use the RANKX function to do this.
1. Click anywhere within your desired table in the Data Pane to the right, then go to the Column tools tab
2. select the New column button
This will do the same thing as when we right clicked on our table and clicked New column.
3. In the formula bar, rename your column then write your DAX code.
Here we are saying inside the Orders table, we want to rank the sales column.
If you'd like to rank in ascending value (i.e., lowest value will have a ranking of 1):
How does RANKX handle ties? Ie, two values of $1.
If we are ranking in ascending order and $1 is the lowest value, they would both get ranked as 1, and the ranking of 2 is skipped. It would move to the next number which is 3; unless you tell it otherwise…
Adding in the Dense argument to the end of RANKX will change the ranks since it’s now not skipping numbers.
Measures
Measures are virtual calculations that don’t become part of your dataset, but are used based on the current context of a report visualization. If file size is an issue you may want to use measures over calculated columns/tables. There are two types of measures; Quick measures which are a template of sorts, and measures which are made from scratch.
Quick measures
We want to create a quick measure in a table that gives us an average value of one column based on another column. e.g. average Sales grouped by Customer Segment.
1. In the left Data tab, right click on the table of choice and select New quick measure.
2. In Quick measure, select Total for category (filters not applied)
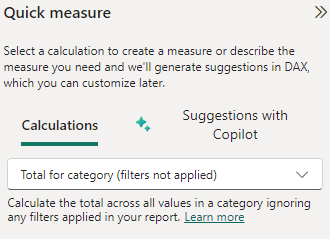
3. Add Your Base value and Category, then update the transformation using the arrow button at the end of each bar. Click Apply when done.

You will be able to verify your Quick measure by checking the formula bar at the top
Measure
We want to create a measure in a table that gives us an average value of one column based on another column. e.g. average Sales per Product category
1. In the Data pane to the right, right click on your desired table and choose New measure
2. Add your DAX code and hit enter.
ALLSELECTED removes any filter applied to the Orders[Product Category] column, meaning when calculating average sales, it considers all product categories.
Time intelligence functions
In order to use a Time intelligence function, you need to have a Date table in your data model.
Creating a date table with CALENDARAUTO
1. In the Data pane make sure your desired table is selected
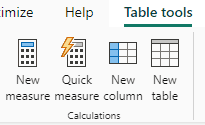
2. In the Table tools tab, select New table
3. Rename the table, and write CALENDARAUTO() at the end of the ‘=’
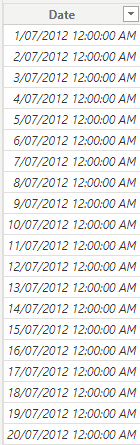
4. To check this creation, head to the Table view on the left hand bar, and click on the newly created table in the Data pane to the right.
We would like to now add the year of each date, quarter, and month in different columns.
1. Update the DAX and hit enter.
ADDCOLUMNS adds more columns.
We type the name of the column followed by the expression.
& is used to concatenate in DAX.
“mmmm” in FORMAT gives us the full month name.

Once you have your date table created, you need to mark it as a date table so Power BI will know which table to reference when we use Time Intelligence functions.
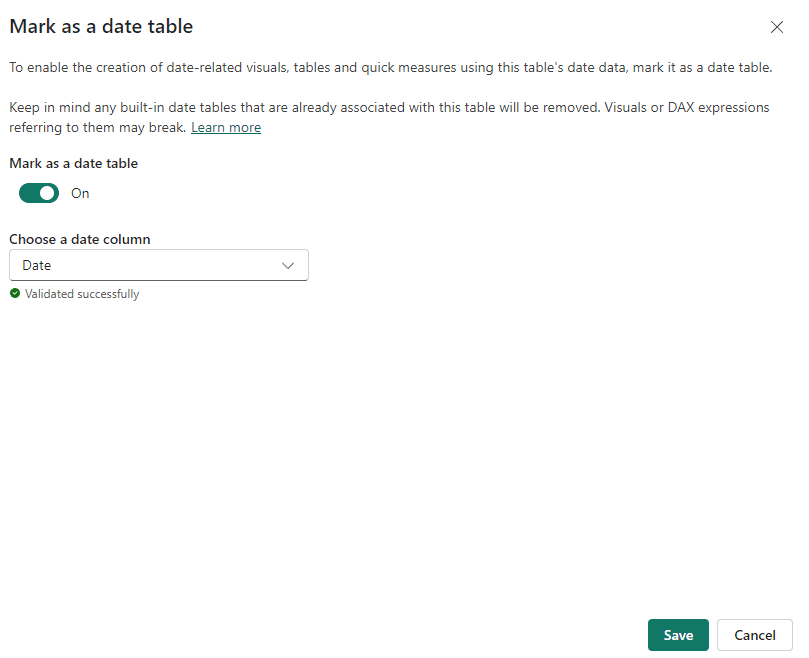
1. Right click the dates tables in the Data pane, and select Mark as date table

2. Switch Mark as date table to On, then choose the column to be used as the date and click Save.
The last thing we need to do is relate the date table to an existing table
1. Head to Model view on the left bar
2. Find the table you’d like to relate it to, and find the date column within this table
3. Drag this date column on top of the Date column in your Dates table
4. Now that we have our existing table related to our dates table, go back to data view
What to do if you receive this error
Since the Orders table now references the Dates table for information, we can delete .[Date]. Update the DAX to:
What is DAX?
DAX stands for Data Analysis Expressions and is the formula language used in Power BI.
DAX is a collection of functions, operators, and constants that can be used in a formula, or expression, to calculate and return one or more values.
DAX context enables you to perform dynamic analysis, in which the results of a formula can change to reflect the current row or cell selection and any related data.
Creating calculated tables
We will start by using the DISTINCT function in DAX to create a calculated table that returns a column of distinct values of another column from another table.
1. Head to the Modelling tab
2. Select New Table in Calculations
A top bar should appear with the text ‘Table = ‘
3. Rename this table
4. Type in your DAX, where we have the name of the table with the column of the table enclosed in square brackets inside DISTINCT(). Hit Enter.
5. Go to Table View
6. On the right hand Data panel, select your table you just created to view.
Creating calculated columns
There are two ways to create a calculated column in Power BI. The first is using the DATEDIFF function, and the second is using the Column tools tab.
Using the DATEDIFF function to calculate the difference in days between two date columns in a table
1. In Table View, in the Data panel to the right, right click on the table of choice and select New Column
A formula bar will appear at the top
2. Rename this column
3. Create your DAX expression, then hit enter.
The first argument represents the first column, the second argument represents the second column, and the third argument represents the interval we want the difference of dates in.
We want it to assess the entire date, so we use .[Date]
4. Scroll to the right in your table, the new column will be at the end.
Creating a calculated column using the Column tools tab that shows a ranking of a column. I.e, the highest value of that column will have a ranking of 1. We will use the RANKX function to do this.
1. Click anywhere within your desired table in the Data Pane to the right, then go to the Column tools tab
2. select the New column button
This will do the same thing as when we right clicked on our table and clicked New column.
3. In the formula bar, rename your column then write your DAX code.
Here we are saying inside the Orders table, we want to rank the sales column.
If you'd like to rank in ascending value (i.e., lowest value will have a ranking of 1):
How does RANKX handle ties? Ie, two values of $1.
If we are ranking in ascending order and $1 is the lowest value, they would both get ranked as 1, and the ranking of 2 is skipped. It would move to the next number which is 3; unless you tell it otherwise…
Adding in the Dense argument to the end of RANKX will change the ranks since it’s now not skipping numbers.
Measures
Measures are virtual calculations that don’t become part of your dataset, but are used based on the current context of a report visualization. If file size is an issue you may want to use measures over calculated columns/tables. There are two types of measures; Quick measures which are a template of sorts, and measures which are made from scratch.
Quick measures
We want to create a quick measure in a table that gives us an average value of one column based on another column. e.g. average Sales grouped by Customer Segment.
1. In the left Data tab, right click on the table of choice and select New quick measure.
2. In Quick measure, select Total for category (filters not applied)
3. Add Your Base value and Category, then update the transformation using the arrow button at the end of each bar. Click Apply when done.
You will be able to verify your Quick measure by checking the formula bar at the top
Measure
We want to create a measure in a table that gives us an average value of one column based on another column. e.g. average Sales per Product category
1. In the Data pane to the right, right click on your desired table and choose New measure
2. Add your DAX code and hit enter.
ALLSELECTED removes any filter applied to the Orders[Product Category] column, meaning when calculating average sales, it considers all product categories.
Time intelligence functions
In order to use a Time intelligence function, you need to have a Date table in your data model.
Creating a date table with CALENDARAUTO
1. In the Data pane make sure your desired table is selected
2. In the Table tools tab, select New table
3. Rename the table, and write CALENDARAUTO() at the end of the ‘=’
4. To check this creation, head to the Table view on the left hand bar, and click on the newly created table in the Data pane to the right.
We would like to now add the year of each date, quarter, and month in different columns.
1. Update the DAX and hit enter.
ADDCOLUMNS adds more columns.
We type the name of the column followed by the expression.
& is used to concatenate in DAX.
“mmmm” in FORMAT gives us the full month name.
Once you have your date table created, you need to mark it as a date table so Power BI will know which table to reference when we use Time Intelligence functions.
1. Right click the dates tables in the Data pane, and select Mark as date table
2. Switch Mark as date table to On, then choose the column to be used as the date and click Save.
The last thing we need to do is relate the date table to an existing table
1. Head to Model view on the left bar
2. Find the table you’d like to relate it to, and find the date column within this table
3. Drag this date column on top of the Date column in your Dates table
4. Now that we have our existing table related to our dates table, go back to data view
What to do if you receive this error
Since the Orders table now references the Dates table for information, we can delete .[Date]. Update the DAX to:
CONTENT
SHARE