CONTENT
Making data work for you in Tableau
Learn how to clean and merge messy datasets in Tableau by interpreting Excel files, handling incomplete values, and using grouping and aliases for effective visualization.


Saartje Ly
Data Engineering Intern
Introduction
Let's say we have a dataset like the one below. There are a lot of issues here that can affect our visualizations, such as blank columns and rows, incomplete/wrong cell values, and multiple values in a cell.
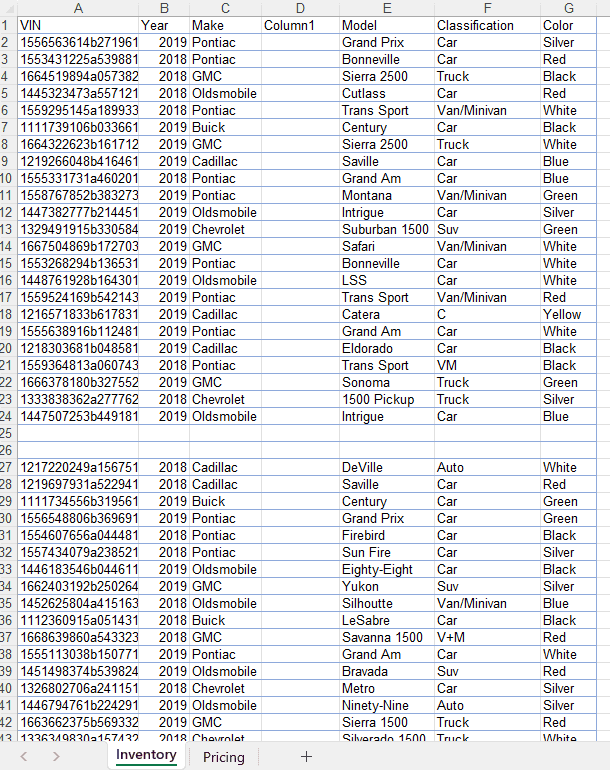
Another issue may be that we have a subset of data on another sheet.

This data is related to the other data with a common field of VIN.
Open Tableau. In the left pane, under To a File, choose Microsoft Excel and open your data.

Tick the User Data Interpreter box.

This will open a new Excel Workbook.
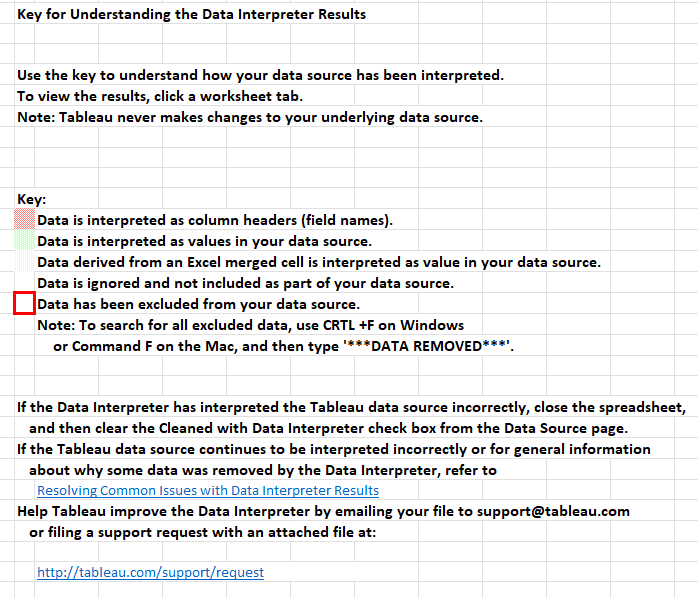

Reading the keys, notice that red is interpreted as a column header, and the green is interpreted as values. If we look at the Pricing tab, it did the same thing. It recognized the columns in the data.
To undo the changes the Data Interpreter may have made, just uncheck the box.
Let's see what we need to do to fix the data.
Drag all of your data onto the canvas. Below you can see that it detects a relationship between the two because of a common field, VIN.
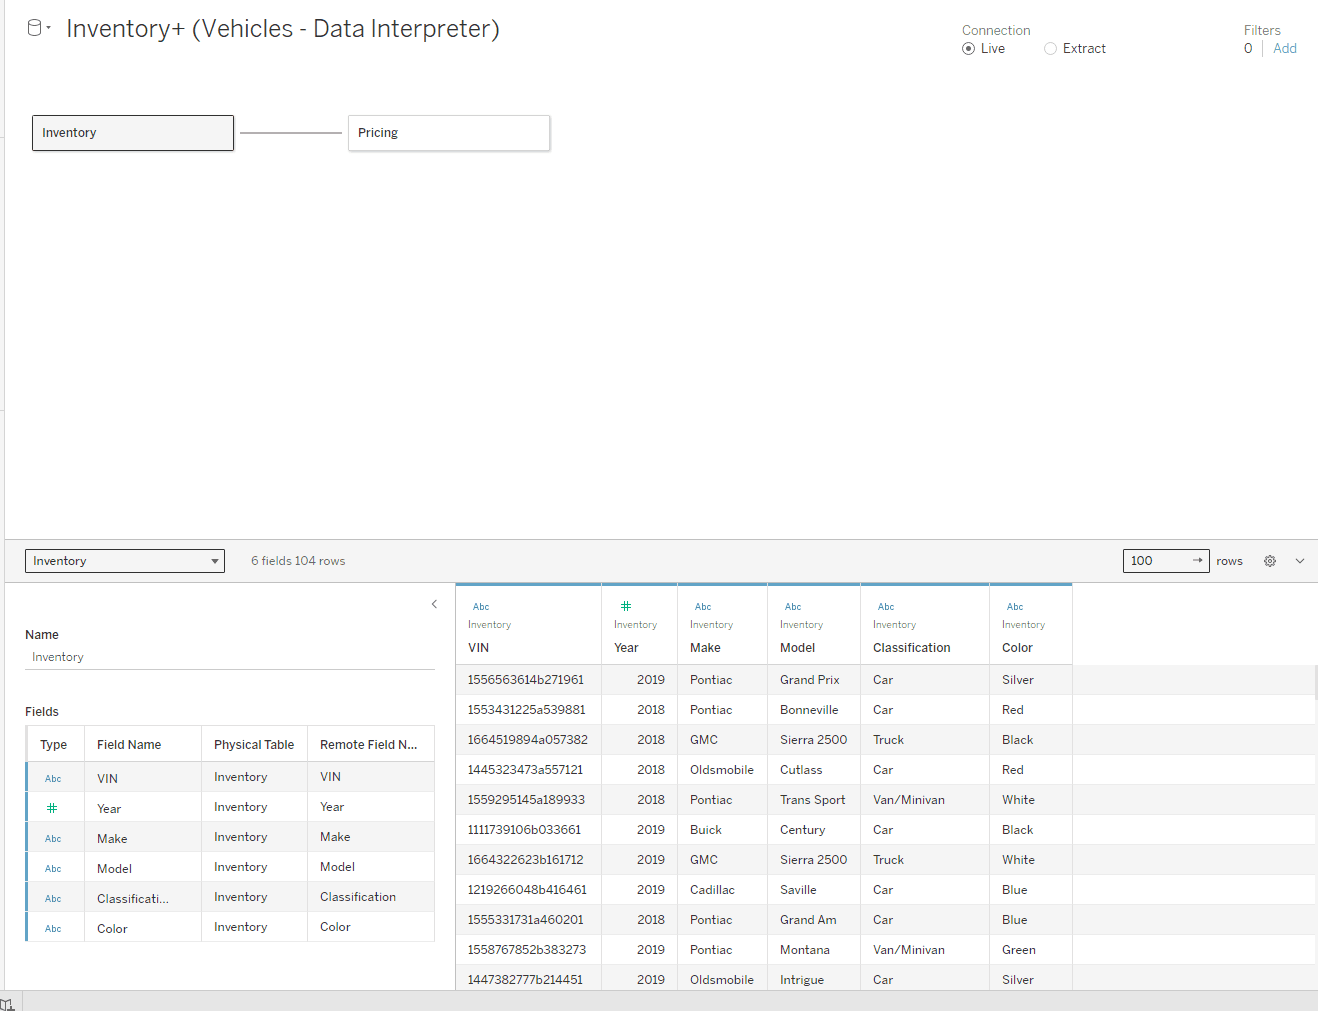
Notice the blank rows and columns are gone.
Joining two datasets
Now, we want to merge our two datasets, Inventory and Pricing.
Double click on a dataset and drag the other dataset back onto the canvas.
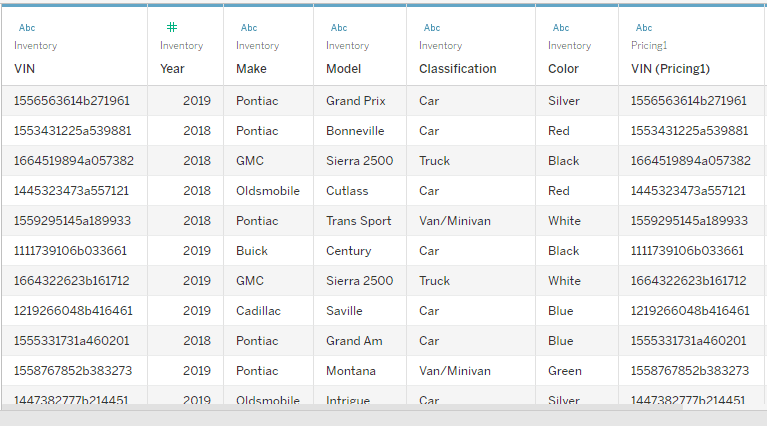
It automatically creates the inner join. Click on the Venn diagram to see what it joined on.

There's no point in having VIN twice, so right click on the column that joined your two datasets and click Hide.
Click the X in the top right corner to exit this layer.
Incorrect values of the same group
Now we will address the issues in the Classification column (incorrect values). Right click on your column heading and click Create Group. This will show all the unique values in that column.

If we knew that C, Car, and Auto were all the same, what we can do is ctrl + click these values, click Group at the bottom, and name the group Car.

If you forgot a value and would like to add it to a group, select it, and up the top click Add to.
Check the Include 'Other' box if you'd like an Other group that includes any members that were not previously grouped.
We can now see a new column called Classification (group) with the corrected data. In this column there are no values called 'Auto' or 'C', only 'Car'.

Aliases
Now let's look at Aliases. Right click on a column, and select Aliases. We can change the value in the Values (Alias) column.

Introduction
Let's say we have a dataset like the one below. There are a lot of issues here that can affect our visualizations, such as blank columns and rows, incomplete/wrong cell values, and multiple values in a cell.
Another issue may be that we have a subset of data on another sheet.
This data is related to the other data with a common field of VIN.
Open Tableau. In the left pane, under To a File, choose Microsoft Excel and open your data.
Tick the User Data Interpreter box.
This will open a new Excel Workbook.
Reading the keys, notice that red is interpreted as a column header, and the green is interpreted as values. If we look at the Pricing tab, it did the same thing. It recognized the columns in the data.
To undo the changes the Data Interpreter may have made, just uncheck the box.
Let's see what we need to do to fix the data.
Drag all of your data onto the canvas. Below you can see that it detects a relationship between the two because of a common field, VIN.
Notice the blank rows and columns are gone.
Joining two datasets
Now, we want to merge our two datasets, Inventory and Pricing.
Double click on a dataset and drag the other dataset back onto the canvas.
It automatically creates the inner join. Click on the Venn diagram to see what it joined on.
There's no point in having VIN twice, so right click on the column that joined your two datasets and click Hide.
Click the X in the top right corner to exit this layer.
Incorrect values of the same group
Now we will address the issues in the Classification column (incorrect values). Right click on your column heading and click Create Group. This will show all the unique values in that column.
If we knew that C, Car, and Auto were all the same, what we can do is ctrl + click these values, click Group at the bottom, and name the group Car.
If you forgot a value and would like to add it to a group, select it, and up the top click Add to.
Check the Include 'Other' box if you'd like an Other group that includes any members that were not previously grouped.
We can now see a new column called Classification (group) with the corrected data. In this column there are no values called 'Auto' or 'C', only 'Car'.
Aliases
Now let's look at Aliases. Right click on a column, and select Aliases. We can change the value in the Values (Alias) column.
CONTENT
SHARE