CONTENT
10 Power BI tips for better dashboards
Explore these 10 Power BI tips to enhance your reports with advanced features like conditional formatting, custom images, tooltips, and more.


Saartje Ly
Data Engineering Intern
April 28, 2024
#1 Conditionally format your charts
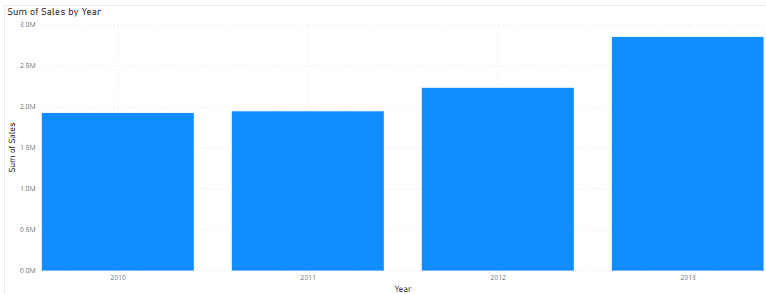
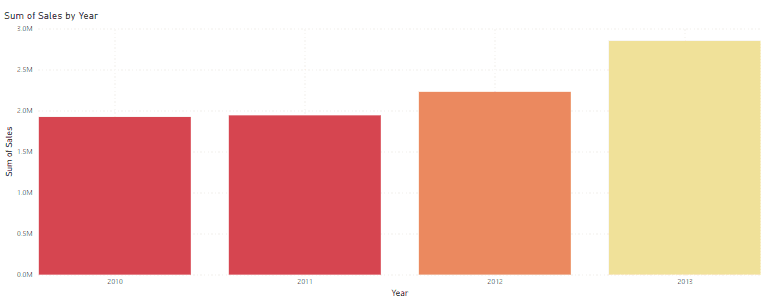
Let’s say we have Sum of Sales by Year, and we want to colour the bars based on the Sum of Sales.
1. Select your chart
2. Go to format options in the Visualizations pane
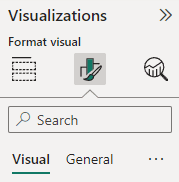
3. Open the Columns drop down
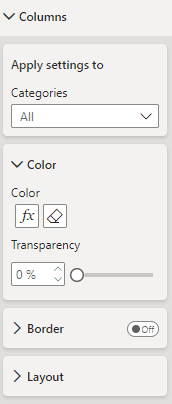
4. Click the fx button under Color
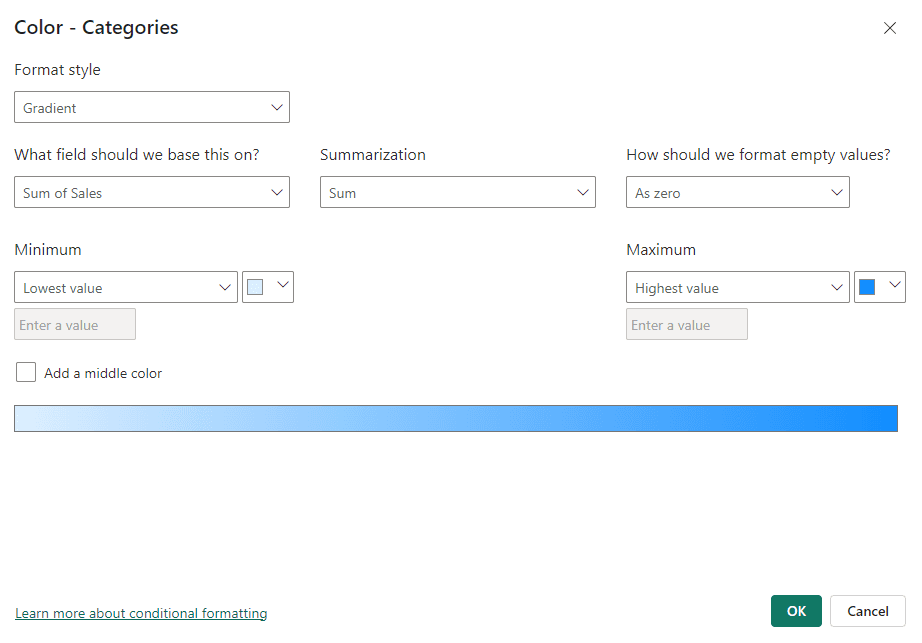
Here you can decide how you want to conditionally format your chart.
5. Under Format style, select Rules
We want values less than 2 million to be red.
We can define it here. Make sure the third box is set to Number, not percent.
6. Add a new rule
We can define that if the value is between 2 million and 2.5 million we want it to be orange
7. Add a new rule
Lastly, we want values above 2.5 million to be yellow

8. Click on OK
#2 Align objects
When you’re laying out your dashboard, it’s important to properly align your objects. If you have a lot of objects, it would be a headache to align everything manually.
Here’s how you can automatically align objects:
1. Select a few objects
Using ctrl + click, or click and drag your mouse over the objects
2. Navigate to the Format tab
3. Select the Align drop down

Here you can choose the types of alignment for your objects.
While selected, you can also move your aligned objects as one group and place them where you need to.
#3 Organize measures
Measures are calculations performed on your data, and are highlighted with the calculator icon.
Columns are fields/attributes within your dataset. They represent the raw data.
If you have a lot of different measures in your data tables and you want to organize them into separate tables, this is what you can do.
1. In the Home tab, click on Enter data to create a dummy table
2. Rename the table and click Load

You will be able to see this table in your Data pane
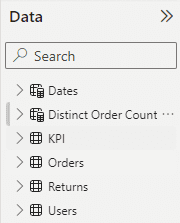
3. Open up a table and select a measure you’d like to move to your new table
A Measure tools tab should open up the top.
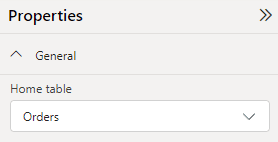
4. Change the Home table box from the current table to your new table.
If you would like to move multiple measures to your new table at once, we don’t have to do it manually.
5. Head to Model view in the left bar
6. In the Data pane, right click on the table you’d like to move measures from and click Select measures
This will select all the measures in your table.
7. From the Properties pane, adjust the Home table to your new table
#4 Organize with folders
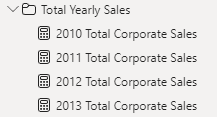
Organize your measures into different folders.
1. Head to the Model view in the left bar
2. Select the measures you’d like to put in a folder
You can select multiple by holding down ctrl + click
3. Create a Display folder in the Properties pane
This will automatically create a folder for your measures.
#5 Custom images
Improve your dashboard with custom backgrounds.
One way to improve your dashboard is to set up the background structure in PowerPoint
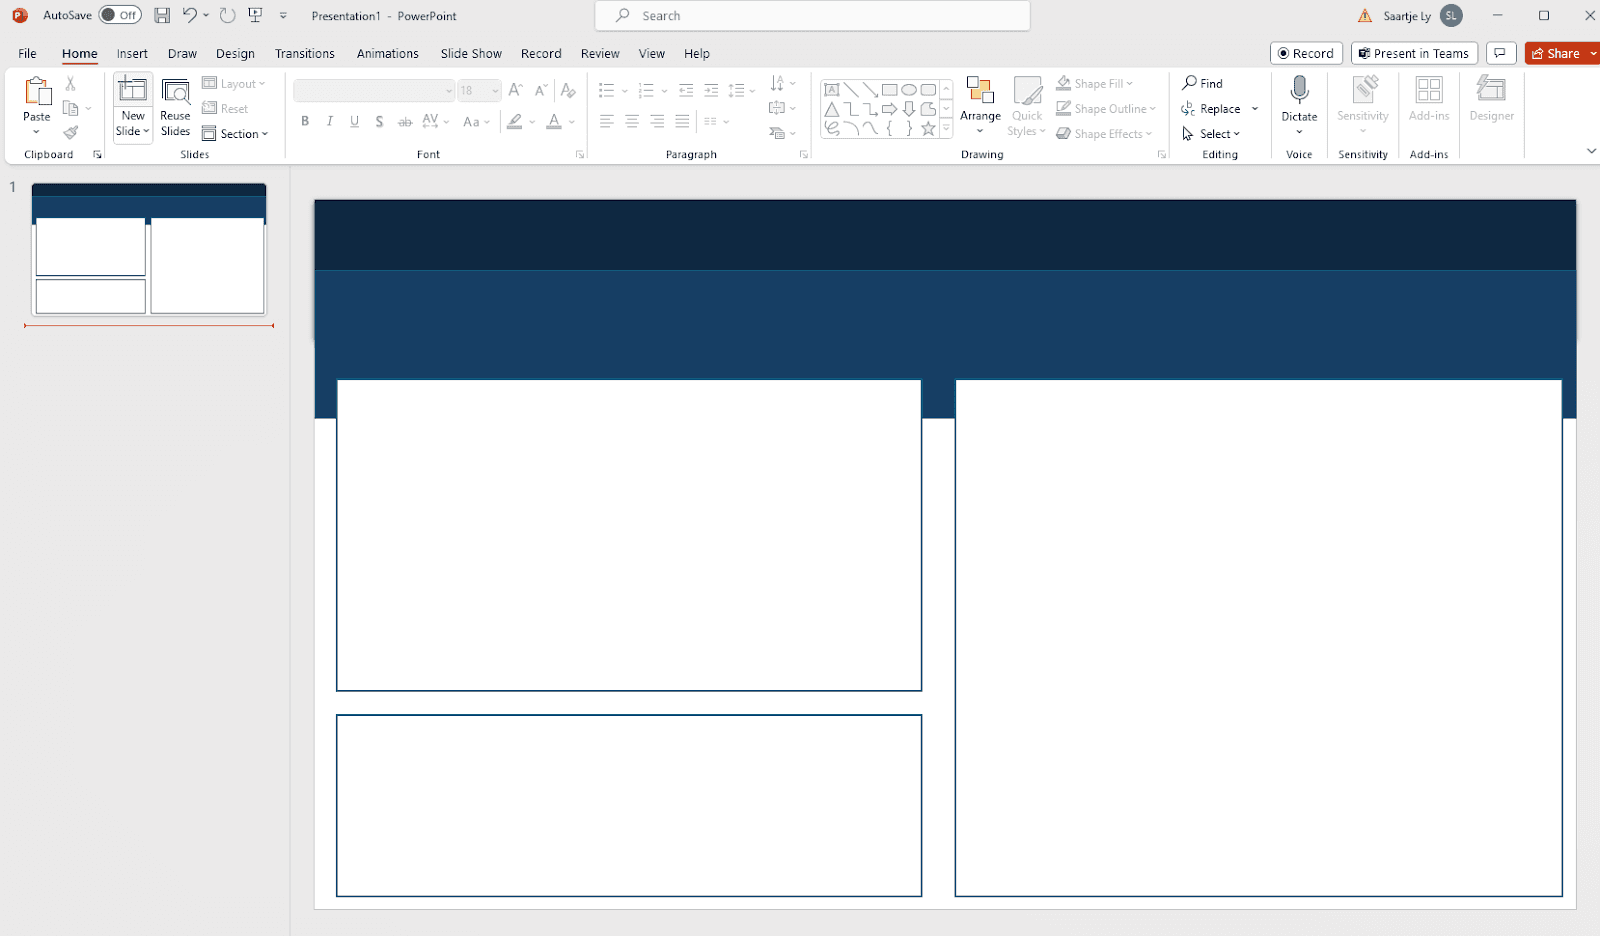
Here, I have a PowerPoint slide with different objects creating the structure.
Save your PowerPoint object as a png.
1. In PowerBI, select the format button under Visualizations
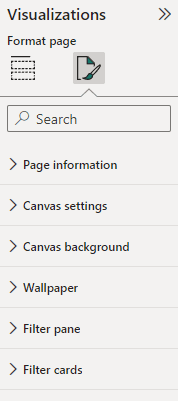
2. Open Canvas Background, select Browse Image, and choose your image.
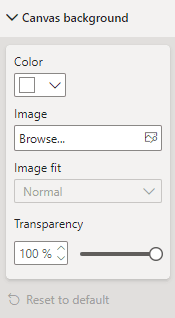
You won’t be able to see your image because of transparency, so adjust this value.
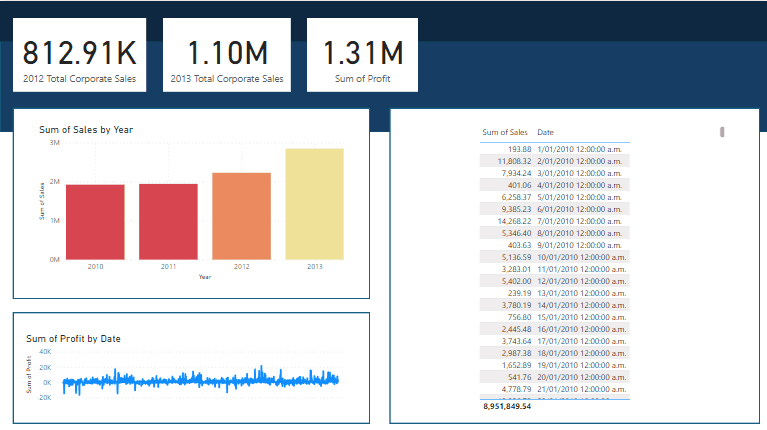
#6 Customize tooltips
In PowerBI whenever you hover over your visuals, you get a default tooltip text. You can add additional information by adding fields to your tooltip.
1. Select a visualization
2. In the Visualizations pane you will see a Tooltips box. Drag and drop a field into this box.
Now, whenever you hover over your visualization you will get the original tooltip plus the extra information from the added tooltip field.
In addition to adding tooltips here, you can also create a separate tooltip page to show when you hover over your visualization.
3. Add a new page
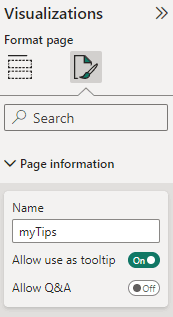
4. In the Visualizations pane under Page information, turn Allow use as tooltip on.
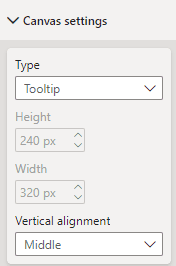
5. Under Canvas settings, change the Vertical alignment to Middle
Now, you can add whatever you want.
6. We are going to add a Text box. You can find this inside Insert.
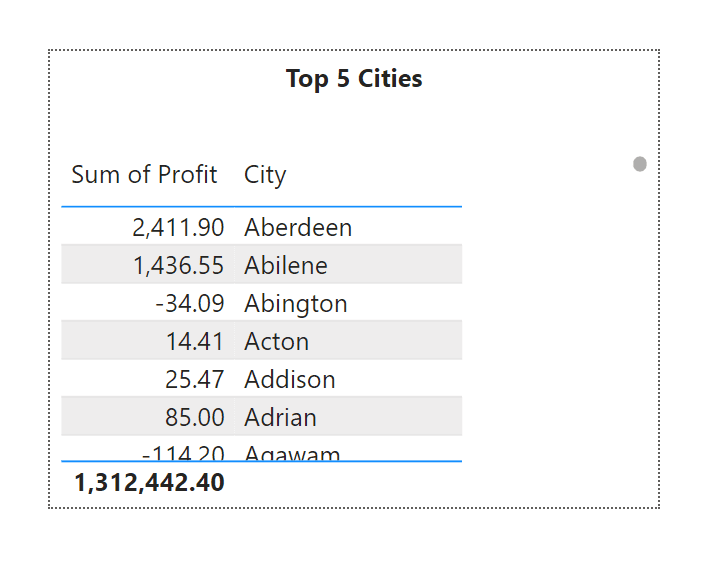
7. We are also going to add a table and populate it with data.
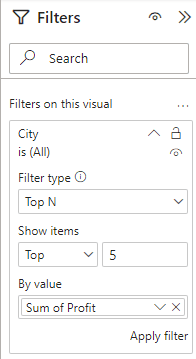
8. We now want to filter the cities to be the top 5 based on Sum of Profit. In the Filters pane, expand the City field. Change Filter type to top N, fill out Show items, then drag and drop a field into By value to filter your Cities by. Click Apply filter.
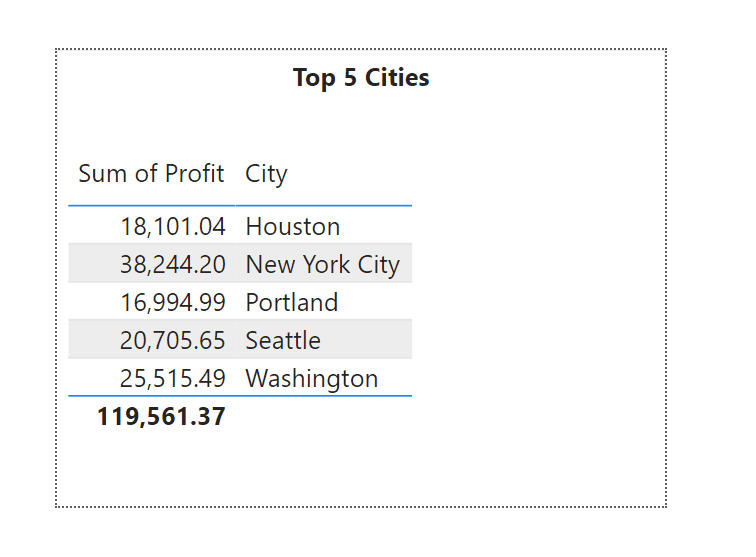
9. Now that we have our tooltip page in place, navigate back to your original page with your visuals.
10. Select your visual then go to Format options in the Visualizations pane.
11. Under Tooltips, under Options, change Type to Report page, and Page to your tooltip page you just created.
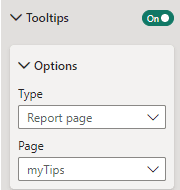
Now whenever you hover over this visualization you should see the tooltip page you have created.
#7 Page navigation
We will now look at creating an automatic table of contents for our dashboard.
1. Head to the insert tab
2. Open the Buttons drop down, open Navigator, then select Page navigator.
This will automatically add buttons for your pages up the top
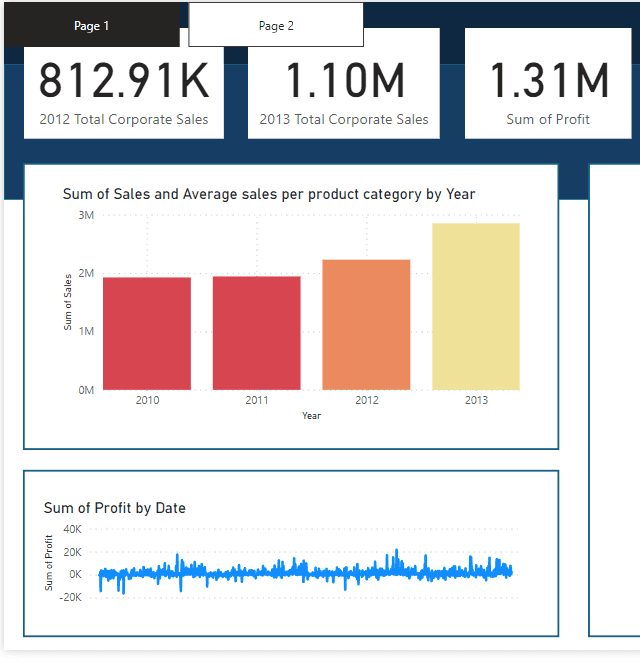
The buttons automatically adjust with renaming and adding tabs.
3. Choose to show hidden and tooltip pages under the Pages drop down in Format navigator
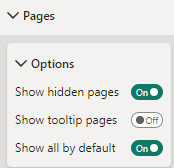
4. Change the button shape as you need under Shape

If you’d like to jump to a specific page, hold down ctrl, then select the button. On the web you just have to click on the button.
#8 Back button
In the previous tip we created a page navigation with buttons. Now, it would be nice to have a way to go back.
1. Head to the Insert tab
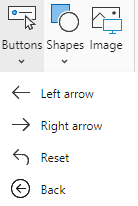
2. Click on the Buttons drop down, then select Back
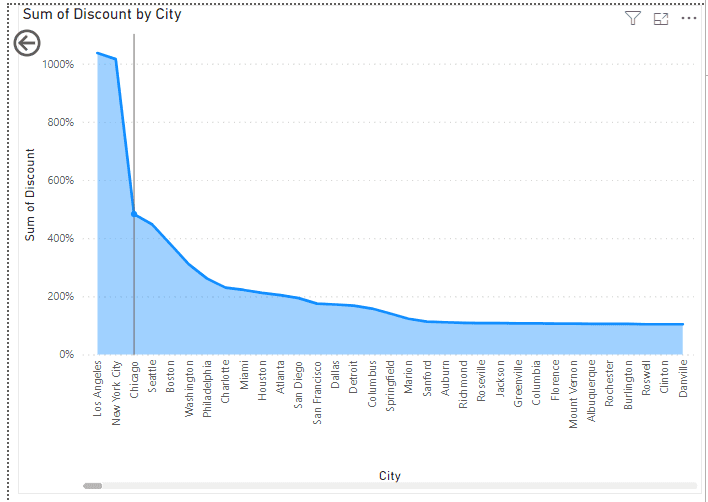
Now, whenever you select it (ctrl+click), it will take you back to the main page.
#9 Lock objects
Once you’ve set up your dashboard and you’re happy with the layout, you want to make sure no one unintentionally goes in and moves the objects around.
1. Press ctrl + A to select all objects
2. Go to the View tab up the top
3. Tick Lock objects
#10 Create a PDF
Create a PDF file out of all your reports that you have in your dashboard.
Go to File, Export, Export to PDF.
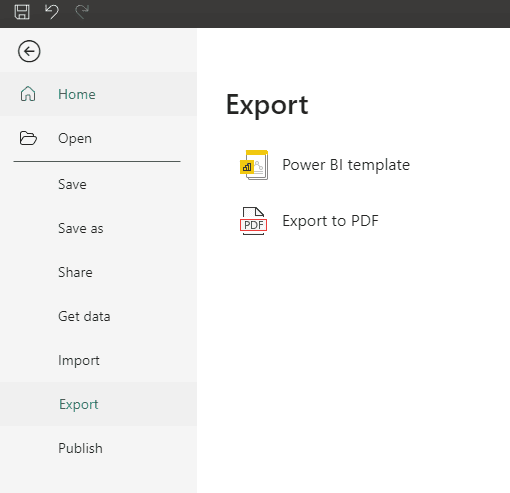
This will go through each tab and generate one PDF document for you.
#1 Conditionally format your charts

Let’s say we have Sum of Sales by Year, and we want to colour the bars based on the Sum of Sales.
1. Select your chart
2. Go to format options in the Visualizations pane

3. Open the Columns drop down

4. Click the fx button under Color

Here you can decide how you want to conditionally format your chart.
5. Under Format style, select Rules
We want values less than 2 million to be red.
We can define it here. Make sure the third box is set to Number, not percent.
6. Add a new rule
We can define that if the value is between 2 million and 2.5 million we want it to be orange
7. Add a new rule
Lastly, we want values above 2.5 million to be yellow

8. Click on OK

#2 Align objects
When you’re laying out your dashboard, it’s important to properly align your objects. If you have a lot of objects, it would be a headache to align everything manually.
Here’s how you can automatically align objects:
1. Select a few objects
Using ctrl + click, or click and drag your mouse over the objects
2. Navigate to the Format tab
3. Select the Align drop down

Here you can choose the types of alignment for your objects.
While selected, you can also move your aligned objects as one group and place them where you need to.
#3 Organize measures
Measures are calculations performed on your data, and are highlighted with the calculator icon.
Columns are fields/attributes within your dataset. They represent the raw data.
If you have a lot of different measures in your data tables and you want to organize them into separate tables, this is what you can do.
1. In the Home tab, click on Enter data to create a dummy table
2. Rename the table and click Load

You will be able to see this table in your Data pane

3. Open up a table and select a measure you’d like to move to your new table
A Measure tools tab should open up the top.
4. Change the Home table box from the current table to your new table.
If you would like to move multiple measures to your new table at once, we don’t have to do it manually.
5. Head to Model view in the left bar
6. In the Data pane, right click on the table you’d like to move measures from and click Select measures
This will select all the measures in your table.
7. From the Properties pane, adjust the Home table to your new table

#4 Organize with folders
Organize your measures into different folders.
1. Head to the Model view in the left bar
2. Select the measures you’d like to put in a folder
You can select multiple by holding down ctrl + click
3. Create a Display folder in the Properties pane
This will automatically create a folder for your measures.

#5 Custom images
Improve your dashboard with custom backgrounds.
One way to improve your dashboard is to set up the background structure in PowerPoint

Here, I have a PowerPoint slide with different objects creating the structure.
Save your PowerPoint object as a png.
1. In PowerBI, select the format button under Visualizations

2. Open Canvas Background, select Browse Image, and choose your image.

You won’t be able to see your image because of transparency, so adjust this value.

#6 Customize tooltips
In PowerBI whenever you hover over your visuals, you get a default tooltip text. You can add additional information by adding fields to your tooltip.
1. Select a visualization
2. In the Visualizations pane you will see a Tooltips box. Drag and drop a field into this box.
Now, whenever you hover over your visualization you will get the original tooltip plus the extra information from the added tooltip field.
In addition to adding tooltips here, you can also create a separate tooltip page to show when you hover over your visualization.
3. Add a new page
4. In the Visualizations pane under Page information, turn Allow use as tooltip on.

5. Under Canvas settings, change the Vertical alignment to Middle

Now, you can add whatever you want.
6. We are going to add a Text box. You can find this inside Insert.
7. We are also going to add a table and populate it with data.

8. We now want to filter the cities to be the top 5 based on Sum of Profit. In the Filters pane, expand the City field. Change Filter type to top N, fill out Show items, then drag and drop a field into By value to filter your Cities by. Click Apply filter.


9. Now that we have our tooltip page in place, navigate back to your original page with your visuals.
10. Select your visual then go to Format options in the Visualizations pane.
11. Under Tooltips, under Options, change Type to Report page, and Page to your tooltip page you just created.

Now whenever you hover over this visualization you should see the tooltip page you have created.
#7 Page navigation
We will now look at creating an automatic table of contents for our dashboard.
1. Head to the insert tab
2. Open the Buttons drop down, open Navigator, then select Page navigator.
This will automatically add buttons for your pages up the top

The buttons automatically adjust with renaming and adding tabs.
3. Choose to show hidden and tooltip pages under the Pages drop down in Format navigator

4. Change the button shape as you need under Shape

If you’d like to jump to a specific page, hold down ctrl, then select the button. On the web you just have to click on the button.
#8 Back button
In the previous tip we created a page navigation with buttons. Now, it would be nice to have a way to go back.
1. Head to the Insert tab
2. Click on the Buttons drop down, then select Back


Now, whenever you select it (ctrl+click), it will take you back to the main page.
#9 Lock objects
Once you’ve set up your dashboard and you’re happy with the layout, you want to make sure no one unintentionally goes in and moves the objects around.
1. Press ctrl + A to select all objects
2. Go to the View tab up the top
3. Tick Lock objects
#10 Create a PDF
Create a PDF file out of all your reports that you have in your dashboard.
Go to File, Export, Export to PDF.

This will go through each tab and generate one PDF document for you.
#1 Conditionally format your charts

Let’s say we have Sum of Sales by Year, and we want to colour the bars based on the Sum of Sales.
1. Select your chart
2. Go to format options in the Visualizations pane

3. Open the Columns drop down

4. Click the fx button under Color

Here you can decide how you want to conditionally format your chart.
5. Under Format style, select Rules
We want values less than 2 million to be red.
We can define it here. Make sure the third box is set to Number, not percent.
6. Add a new rule
We can define that if the value is between 2 million and 2.5 million we want it to be orange
7. Add a new rule
Lastly, we want values above 2.5 million to be yellow

8. Click on OK

#2 Align objects
When you’re laying out your dashboard, it’s important to properly align your objects. If you have a lot of objects, it would be a headache to align everything manually.
Here’s how you can automatically align objects:
1. Select a few objects
Using ctrl + click, or click and drag your mouse over the objects
2. Navigate to the Format tab
3. Select the Align drop down

Here you can choose the types of alignment for your objects.
While selected, you can also move your aligned objects as one group and place them where you need to.
#3 Organize measures
Measures are calculations performed on your data, and are highlighted with the calculator icon.
Columns are fields/attributes within your dataset. They represent the raw data.
If you have a lot of different measures in your data tables and you want to organize them into separate tables, this is what you can do.
1. In the Home tab, click on Enter data to create a dummy table
2. Rename the table and click Load

You will be able to see this table in your Data pane

3. Open up a table and select a measure you’d like to move to your new table
A Measure tools tab should open up the top.
4. Change the Home table box from the current table to your new table.
If you would like to move multiple measures to your new table at once, we don’t have to do it manually.
5. Head to Model view in the left bar
6. In the Data pane, right click on the table you’d like to move measures from and click Select measures
This will select all the measures in your table.
7. From the Properties pane, adjust the Home table to your new table

#4 Organize with folders
Organize your measures into different folders.
1. Head to the Model view in the left bar
2. Select the measures you’d like to put in a folder
You can select multiple by holding down ctrl + click
3. Create a Display folder in the Properties pane
This will automatically create a folder for your measures.

#5 Custom images
Improve your dashboard with custom backgrounds.
One way to improve your dashboard is to set up the background structure in PowerPoint

Here, I have a PowerPoint slide with different objects creating the structure.
Save your PowerPoint object as a png.
1. In PowerBI, select the format button under Visualizations

2. Open Canvas Background, select Browse Image, and choose your image.

You won’t be able to see your image because of transparency, so adjust this value.

#6 Customize tooltips
In PowerBI whenever you hover over your visuals, you get a default tooltip text. You can add additional information by adding fields to your tooltip.
1. Select a visualization
2. In the Visualizations pane you will see a Tooltips box. Drag and drop a field into this box.
Now, whenever you hover over your visualization you will get the original tooltip plus the extra information from the added tooltip field.
In addition to adding tooltips here, you can also create a separate tooltip page to show when you hover over your visualization.
3. Add a new page
4. In the Visualizations pane under Page information, turn Allow use as tooltip on.

5. Under Canvas settings, change the Vertical alignment to Middle

Now, you can add whatever you want.
6. We are going to add a Text box. You can find this inside Insert.
7. We are also going to add a table and populate it with data.

8. We now want to filter the cities to be the top 5 based on Sum of Profit. In the Filters pane, expand the City field. Change Filter type to top N, fill out Show items, then drag and drop a field into By value to filter your Cities by. Click Apply filter.


9. Now that we have our tooltip page in place, navigate back to your original page with your visuals.
10. Select your visual then go to Format options in the Visualizations pane.
11. Under Tooltips, under Options, change Type to Report page, and Page to your tooltip page you just created.

Now whenever you hover over this visualization you should see the tooltip page you have created.
#7 Page navigation
We will now look at creating an automatic table of contents for our dashboard.
1. Head to the insert tab
2. Open the Buttons drop down, open Navigator, then select Page navigator.
This will automatically add buttons for your pages up the top

The buttons automatically adjust with renaming and adding tabs.
3. Choose to show hidden and tooltip pages under the Pages drop down in Format navigator

4. Change the button shape as you need under Shape

If you’d like to jump to a specific page, hold down ctrl, then select the button. On the web you just have to click on the button.
#8 Back button
In the previous tip we created a page navigation with buttons. Now, it would be nice to have a way to go back.
1. Head to the Insert tab
2. Click on the Buttons drop down, then select Back


Now, whenever you select it (ctrl+click), it will take you back to the main page.
#9 Lock objects
Once you’ve set up your dashboard and you’re happy with the layout, you want to make sure no one unintentionally goes in and moves the objects around.
1. Press ctrl + A to select all objects
2. Go to the View tab up the top
3. Tick Lock objects
#10 Create a PDF
Create a PDF file out of all your reports that you have in your dashboard.
Go to File, Export, Export to PDF.

This will go through each tab and generate one PDF document for you.
CONTENT
SHARE