CONTENT
Create a basic Power BI dashboard
Learn how to create text banners and add visualizations to your Power BI report for a polished, professional look.

Saartje Ly
Data Engineering Intern
April 21, 2024
Basic Power BI Dashboard
1. Load in your data
2. Head to the Insert tab
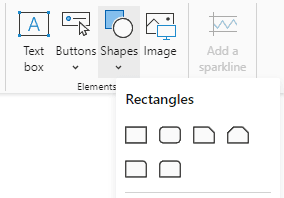
3. Open the Shapes drop down in Elements, and click on a rectangle
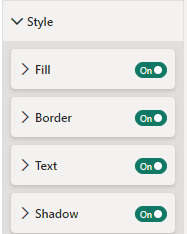
4. Under Style in the Format shape pane, edit the Fill, Text, and Shadow of this rectangle.
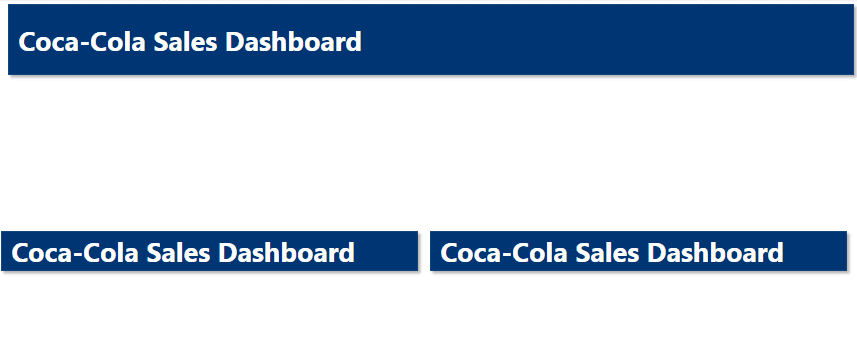
5. Stretch this rectangle to the width of your canvas to complete your text banner.
6. Copy and paste this banner two times, resize and move these copies
7. Drag and drop visualizations from the Visualizations pane into the canvas
8. Drag and drop data from the Data pane into your visualizations
9. Resize your visualizations so they fit to the canvas
If you can’t see your visualization too well, open focus mode - the middle button up the top right corner when you click on your chart
10. Rename the middle two banners to match your visualizations
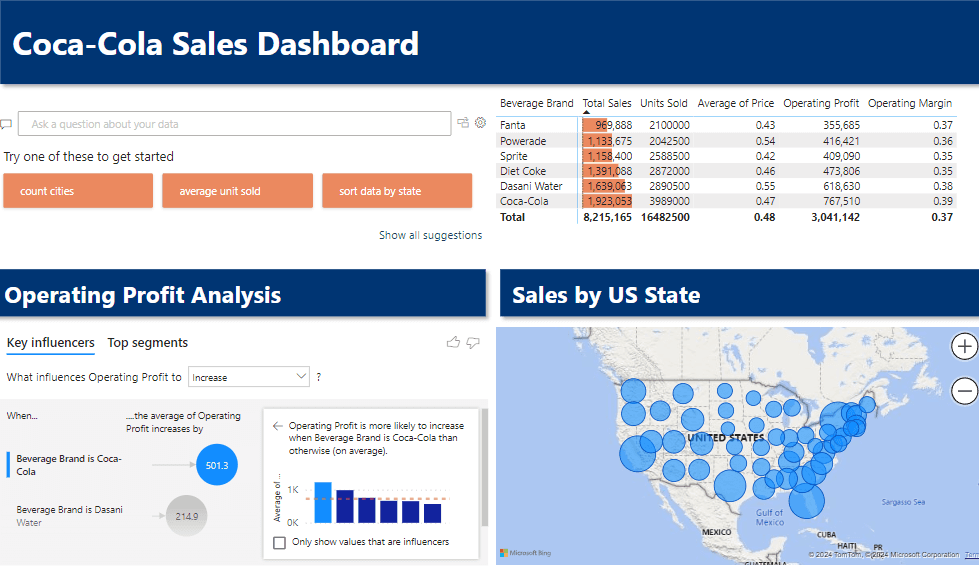
Basic Power BI Dashboard
1. Load in your data
2. Head to the Insert tab
3. Open the Shapes drop down in Elements, and click on a rectangle

4. Under Style in the Format shape pane, edit the Fill, Text, and Shadow of this rectangle.

5. Stretch this rectangle to the width of your canvas to complete your text banner.
6. Copy and paste this banner two times, resize and move these copies

7. Drag and drop visualizations from the Visualizations pane into the canvas
8. Drag and drop data from the Data pane into your visualizations
9. Resize your visualizations so they fit to the canvas
If you can’t see your visualization too well, open focus mode - the middle button up the top right corner when you click on your chart
10. Rename the middle two banners to match your visualizations

Basic Power BI Dashboard
1. Load in your data
2. Head to the Insert tab
3. Open the Shapes drop down in Elements, and click on a rectangle

4. Under Style in the Format shape pane, edit the Fill, Text, and Shadow of this rectangle.

5. Stretch this rectangle to the width of your canvas to complete your text banner.
6. Copy and paste this banner two times, resize and move these copies

7. Drag and drop visualizations from the Visualizations pane into the canvas
8. Drag and drop data from the Data pane into your visualizations
9. Resize your visualizations so they fit to the canvas
If you can’t see your visualization too well, open focus mode - the middle button up the top right corner when you click on your chart
10. Rename the middle two banners to match your visualizations

CONTENT
SHARE