CONTENT
Year on Year (YoY) comparisons in Power BI
Time trends are among the most common ways to provide insights in almost every industry. Applicable in every dataset from Sales, Impressions, Website visits, etc, they are great at generating insights around: Average baseline, Linear or Exponential, Seasonality, Growth


Jackie Tejwani
Director - Business Intelligence
October 7, 2024
Year on Year (YoY) comparisons in Power BI
Time trends are among the most common ways to provide insights in almost every industry. Applicable in every dataset from Sales, Impressions, Website visits, etc, they are great at generating insights around:
- Average baseline
- Linear or Exponential
- Seasonality
- Growth
In this blog I will introduce the concepts of time intelligence in Power BI, working with line charts and understanding the difference between cumulative and non-cumulative trends.
Time Intelligence in Power BI
Time intelligence refers to a set of features and functions in Power BI that help analyze and compare data across different periods of time. Full-list: https://learn.microsoft.com/en-us/dax/time-intelligence-functions-dax
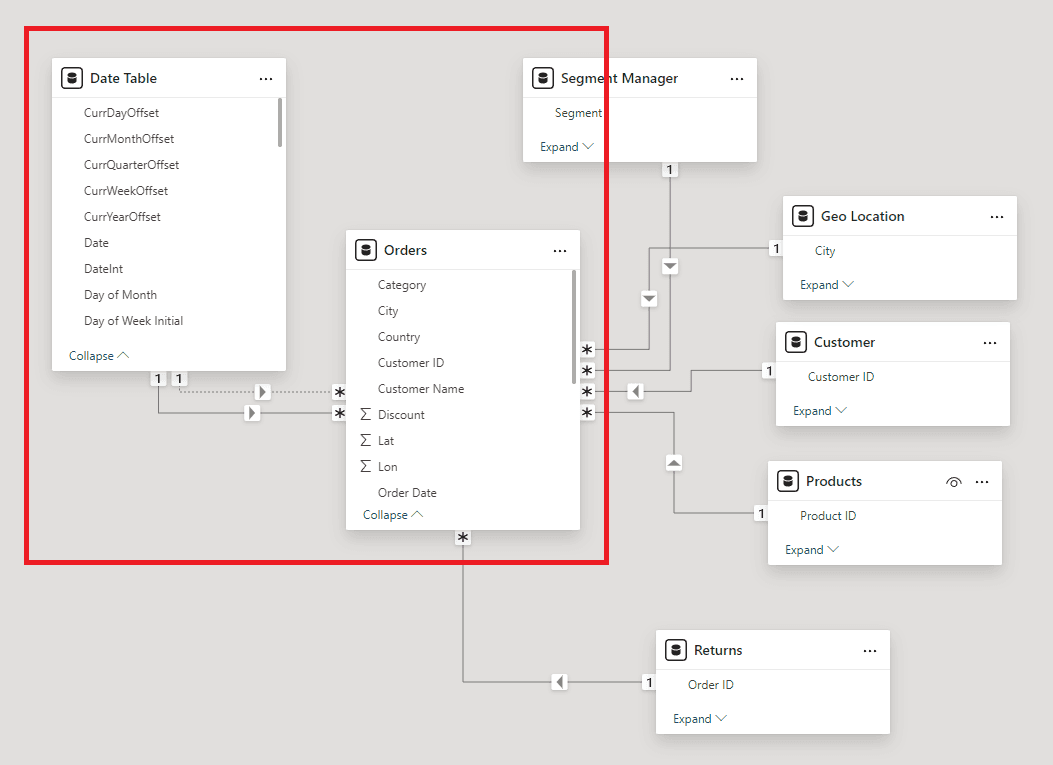
They work best alongside your Dim Date table which is marked as the date table within the data model

Within the sea of these functions, the most common and versatile ones to use are:
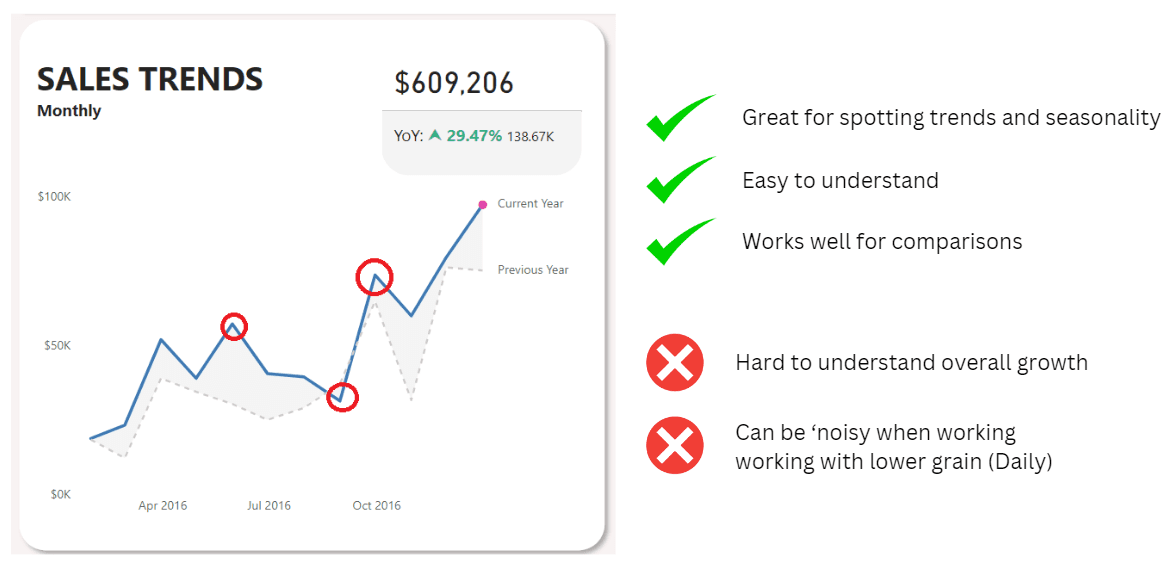
Sameperiodlastyear = CALCULATE( [Sales], SAMEPERIODLASTYEAR( 'Date Table'[Date]))Dateadd = CALCULATE( [Sales], DATEADD( 'Date Table'[Date], -1, YEAR)))YTD = CALCULATE( [Sales], DATESYTD( 'Date Table'[Date]))MTD = CALCULATE( [Sales], DATESMTD( 'Date Table'[Date]))Line chart for Monthly Trends (Non-Cumulative)

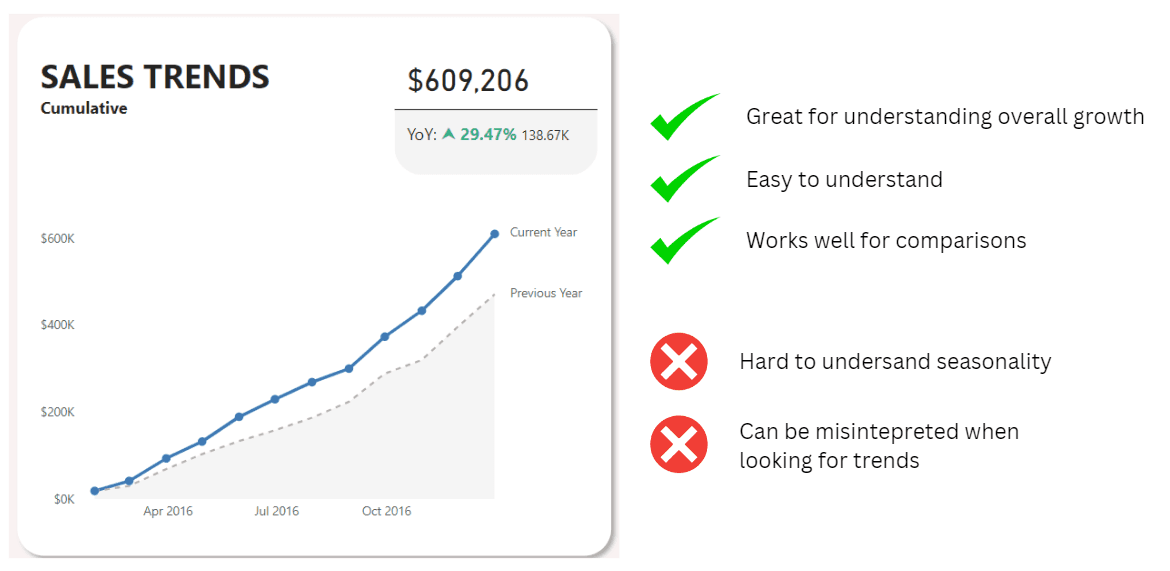
Sales = SUM(Orders[Sales])Sales PY = CALCULATE( [Sales], DATEADD( 'Date Table'[Date], -1, YEAR))Line chart for Cumulative Trends

YTD = CALCULATE( [Sales], DATESYTD( 'Date Table'[Date]))Previous YTD = CALCULATE( [Sales PY], DATESYTD( 'Date Table'[Date]))Year on Year (YoY) comparisons in Power BI
Time trends are among the most common ways to provide insights in almost every industry. Applicable in every dataset from Sales, Impressions, Website visits, etc, they are great at generating insights around:
- Average baseline
- Linear or Exponential
- Seasonality
- Growth
In this blog I will introduce the concepts of time intelligence in Power BI, working with line charts and understanding the difference between cumulative and non-cumulative trends.
Time Intelligence in Power BI
Time intelligence refers to a set of features and functions in Power BI that help analyze and compare data across different periods of time. Full-list: https://learn.microsoft.com/en-us/dax/time-intelligence-functions-dax
They work best alongside your Dim Date table which is marked as the date table within the data model

Within the sea of these functions, the most common and versatile ones to use are:
Sameperiodlastyear = CALCULATE( [Sales], SAMEPERIODLASTYEAR( 'Date Table'[Date]))Dateadd = CALCULATE( [Sales], DATEADD( 'Date Table'[Date], -1, YEAR)))YTD = CALCULATE( [Sales], DATESYTD( 'Date Table'[Date]))MTD = CALCULATE( [Sales], DATESMTD( 'Date Table'[Date]))Line chart for Monthly Trends (Non-Cumulative)

Sales = SUM(Orders[Sales])Sales PY = CALCULATE( [Sales], DATEADD( 'Date Table'[Date], -1, YEAR))Line chart for Cumulative Trends

YTD = CALCULATE( [Sales], DATESYTD( 'Date Table'[Date]))Previous YTD = CALCULATE( [Sales PY], DATESYTD( 'Date Table'[Date]))Year on Year (YoY) comparisons in Power BI
Time trends are among the most common ways to provide insights in almost every industry. Applicable in every dataset from Sales, Impressions, Website visits, etc, they are great at generating insights around:
- Average baseline
- Linear or Exponential
- Seasonality
- Growth
In this blog I will introduce the concepts of time intelligence in Power BI, working with line charts and understanding the difference between cumulative and non-cumulative trends.
Time Intelligence in Power BI
Time intelligence refers to a set of features and functions in Power BI that help analyze and compare data across different periods of time. Full-list: https://learn.microsoft.com/en-us/dax/time-intelligence-functions-dax
They work best alongside your Dim Date table which is marked as the date table within the data model

Within the sea of these functions, the most common and versatile ones to use are:
Sameperiodlastyear = CALCULATE( [Sales], SAMEPERIODLASTYEAR( 'Date Table'[Date]))Dateadd = CALCULATE( [Sales], DATEADD( 'Date Table'[Date], -1, YEAR)))YTD = CALCULATE( [Sales], DATESYTD( 'Date Table'[Date]))MTD = CALCULATE( [Sales], DATESMTD( 'Date Table'[Date]))Line chart for Monthly Trends (Non-Cumulative)

Sales = SUM(Orders[Sales])Sales PY = CALCULATE( [Sales], DATEADD( 'Date Table'[Date], -1, YEAR))Line chart for Cumulative Trends

YTD = CALCULATE( [Sales], DATESYTD( 'Date Table'[Date]))Previous YTD = CALCULATE( [Sales PY], DATESYTD( 'Date Table'[Date]))CONTENT
SHARE