CONTENT
How to use Joins in Tableau
Learn how to perform joins in Tableau to combine data from multiple sources, enhancing your visualizations with richer information.


Saartje Ly
Data Engineering Intern
July 17, 2024
How to use Joins in Tableau
Joins in Tableau are crucial for creating more informative visualizations that draw on wider arrays of information.
Firstly, we'll want to start by downloading the data from here
You'll notice in this data that in the Demographics tab, we have 10 rows of employee data. In the JobTitle tab, we also have 10 rows of employee data but the last row is missing it's EmployeeID. Finally in the last tab - Salary - we only have 7 rows of data.
Open Tableau. Here we can connect to our data - click on Microsoft Excel, and open the data we downloaded.
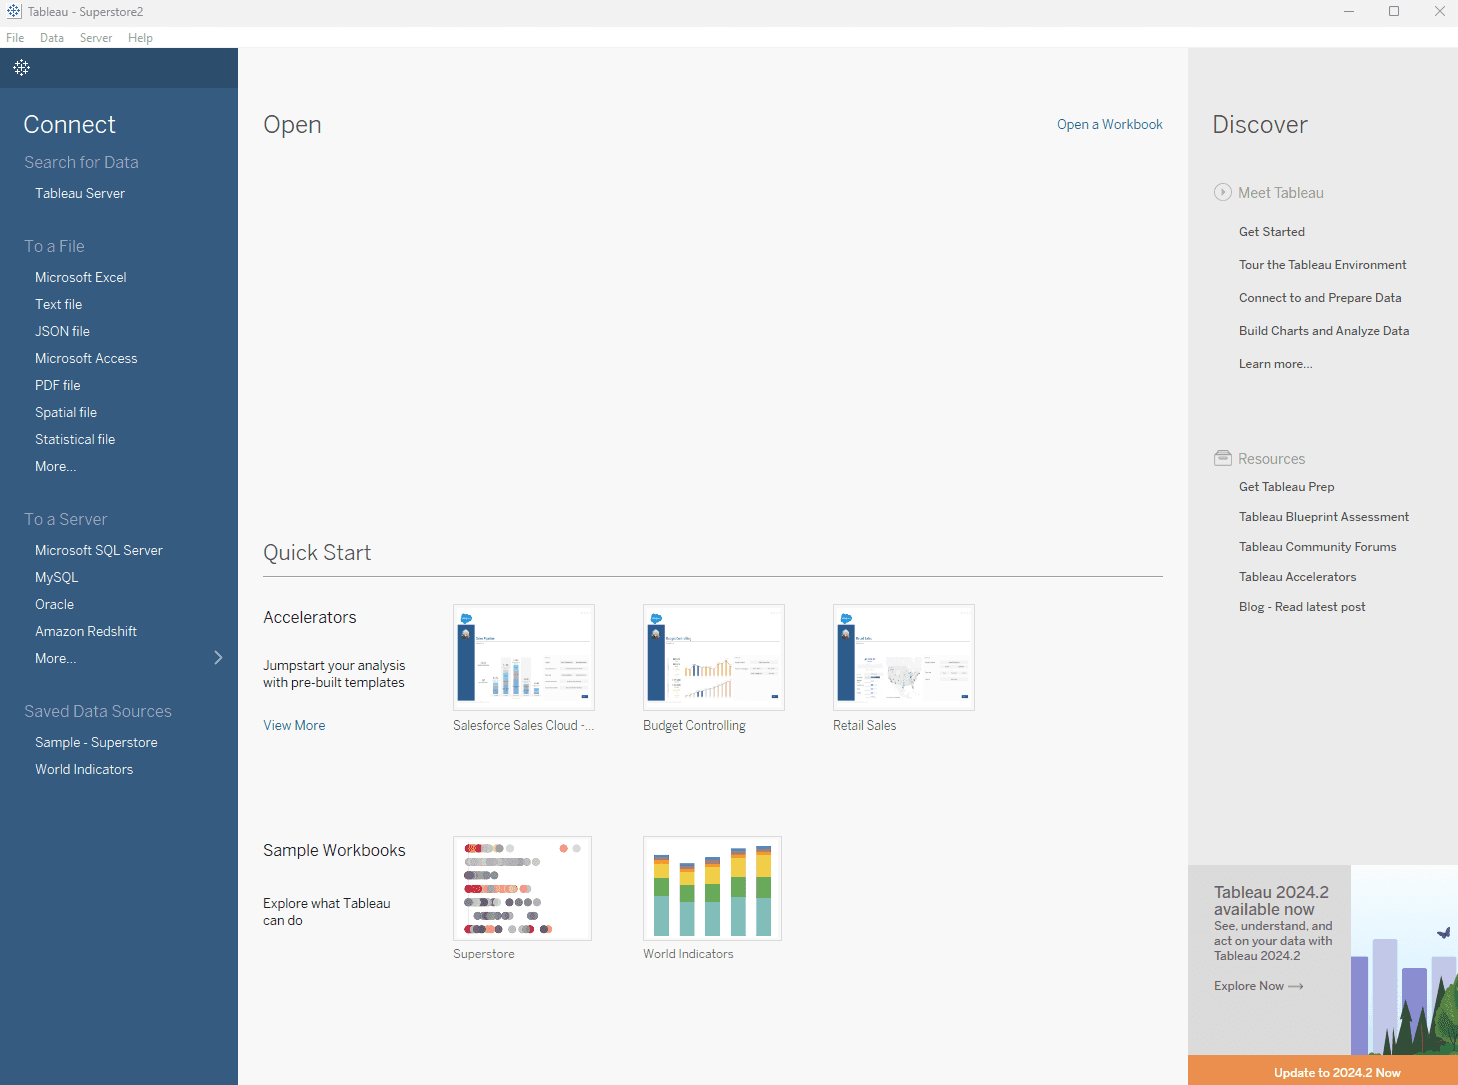
Once it's opened, click and drag Demographics in the left pane to the empty canvas.
Click and drag Job Title onto the canvas. Here you'll see a relationship, not a join. You can learn more about the difference down here.
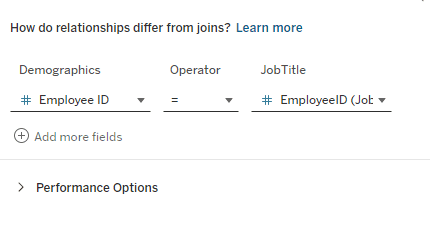
Click and drag Job Title from the canvas off of it.
Hover over Demographics on the canvas, click the dropdown arrow, and click open.
So, now we are in a place where we can actually create the joins.
Pull over Job Title and drop it on the canvas.

Click on the Venn Diagram to select what type of join you'd like to do.
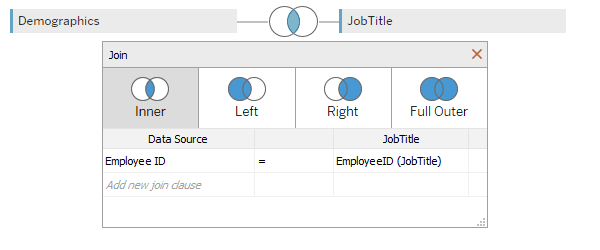
What it's doing right now is it's doing an inner join. So, it's pulling everything that overlaps - If the two match on EmployeeID.
You'll notice we only have IDs 1001 through to 1009. If you remember, we had IDs from 1001 to 1010 in Demographics. The tenth one is not there as 1010 doesn't exist in JobTitle.
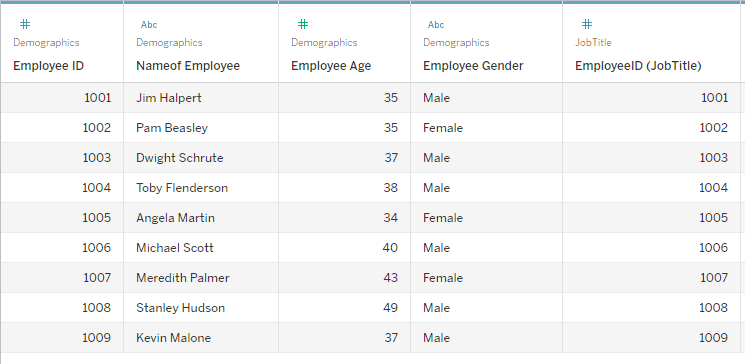
There are two different types of joins we can use if we want to see the tenth ID. The first one we can look at is the Right join. It's going to show everything from the right table (JobTitle) regardless, and it will only show things from the left table (Demographics) if there's a match. Left join is similar - it shows everything from the left table and only shows things from the right table if there's a match.
Then, there's full outer. Full outer takes everything from both regardless of if there's a match at all. In full outer you'll see Ryan Howard twice. This is because he exists in Demographics and exists in JobTitle yet there is no EmployeeID to match him by.
Now, there is a way to join by something else other than EmployeeID. Change the join to Nameof Employee and Employee Name.
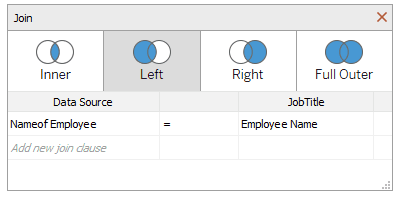
Change to an inner join. You should see everything except for the 1010 ID for Ryan from JobTitle.

This way is less thought of - usually if there's an ID you join by ID however since we had a lack of data in one of the tables we decided to use a different column. Now we're able to look at all the data together.
Now, drag over and drop in Salary. We have rows of data where the salary was available for that ID.


How to use Joins in Tableau
Joins in Tableau are crucial for creating more informative visualizations that draw on wider arrays of information.
Firstly, we'll want to start by downloading the data from here
You'll notice in this data that in the Demographics tab, we have 10 rows of employee data. In the JobTitle tab, we also have 10 rows of employee data but the last row is missing it's EmployeeID. Finally in the last tab - Salary - we only have 7 rows of data.
Open Tableau. Here we can connect to our data - click on Microsoft Excel, and open the data we downloaded.

Once it's opened, click and drag Demographics in the left pane to the empty canvas.
Click and drag Job Title onto the canvas. Here you'll see a relationship, not a join. You can learn more about the difference down here.

Click and drag Job Title from the canvas off of it.
Hover over Demographics on the canvas, click the dropdown arrow, and click open.
So, now we are in a place where we can actually create the joins.
Pull over Job Title and drop it on the canvas.

Click on the Venn Diagram to select what type of join you'd like to do.

What it's doing right now is it's doing an inner join. So, it's pulling everything that overlaps - If the two match on EmployeeID.
You'll notice we only have IDs 1001 through to 1009. If you remember, we had IDs from 1001 to 1010 in Demographics. The tenth one is not there as 1010 doesn't exist in JobTitle.

There are two different types of joins we can use if we want to see the tenth ID. The first one we can look at is the Right join. It's going to show everything from the right table (JobTitle) regardless, and it will only show things from the left table (Demographics) if there's a match. Left join is similar - it shows everything from the left table and only shows things from the right table if there's a match.
Then, there's full outer. Full outer takes everything from both regardless of if there's a match at all. In full outer you'll see Ryan Howard twice. This is because he exists in Demographics and exists in JobTitle yet there is no EmployeeID to match him by.
Now, there is a way to join by something else other than EmployeeID. Change the join to Nameof Employee and Employee Name.

Change to an inner join. You should see everything except for the 1010 ID for Ryan from JobTitle.

This way is less thought of - usually if there's an ID you join by ID however since we had a lack of data in one of the tables we decided to use a different column. Now we're able to look at all the data together.
Now, drag over and drop in Salary. We have rows of data where the salary was available for that ID.


How to use Joins in Tableau
Joins in Tableau are crucial for creating more informative visualizations that draw on wider arrays of information.
Firstly, we'll want to start by downloading the data from here
You'll notice in this data that in the Demographics tab, we have 10 rows of employee data. In the JobTitle tab, we also have 10 rows of employee data but the last row is missing it's EmployeeID. Finally in the last tab - Salary - we only have 7 rows of data.
Open Tableau. Here we can connect to our data - click on Microsoft Excel, and open the data we downloaded.

Once it's opened, click and drag Demographics in the left pane to the empty canvas.
Click and drag Job Title onto the canvas. Here you'll see a relationship, not a join. You can learn more about the difference down here.

Click and drag Job Title from the canvas off of it.
Hover over Demographics on the canvas, click the dropdown arrow, and click open.
So, now we are in a place where we can actually create the joins.
Pull over Job Title and drop it on the canvas.

Click on the Venn Diagram to select what type of join you'd like to do.

What it's doing right now is it's doing an inner join. So, it's pulling everything that overlaps - If the two match on EmployeeID.
You'll notice we only have IDs 1001 through to 1009. If you remember, we had IDs from 1001 to 1010 in Demographics. The tenth one is not there as 1010 doesn't exist in JobTitle.

There are two different types of joins we can use if we want to see the tenth ID. The first one we can look at is the Right join. It's going to show everything from the right table (JobTitle) regardless, and it will only show things from the left table (Demographics) if there's a match. Left join is similar - it shows everything from the left table and only shows things from the right table if there's a match.
Then, there's full outer. Full outer takes everything from both regardless of if there's a match at all. In full outer you'll see Ryan Howard twice. This is because he exists in Demographics and exists in JobTitle yet there is no EmployeeID to match him by.
Now, there is a way to join by something else other than EmployeeID. Change the join to Nameof Employee and Employee Name.

Change to an inner join. You should see everything except for the 1010 ID for Ryan from JobTitle.

This way is less thought of - usually if there's an ID you join by ID however since we had a lack of data in one of the tables we decided to use a different column. Now we're able to look at all the data together.
Now, drag over and drop in Salary. We have rows of data where the salary was available for that ID.


CONTENT
SHARE