CONTENT
From Concatenation to Data Blending and Optimization in Tableau
Learn how to concatenate fields, format sales data, blend multiple data sources, and optimize visualizations in Tableau.


Saartje Ly
Data Engineering Intern
July 29, 2024
In Tableau, open the Sample Superstore workbook.
Customer Sales by Region/State
The first thing we want to do is learn how to concatenate. We want to put the region and the state together. Click on the down arrow next to the search bar to the left, and choose Create Calculated Field.
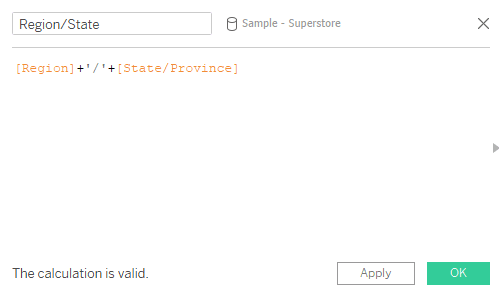
Insert this below. Here we are saying concatenate Region and State/Province with a slash. Click OK.
Now we want to grab the Region/State field we just created, and we want to add it to the hierarchy of Location.
Hover over Region/State and click on its down arrow, hover over Hierarchy, Add to Hierarchy, and choose Location. Once it's in the hierarchy, drag it up so that it's right below Region.
Let's drag Region/State to the Filters shelf, select All, then click OK.
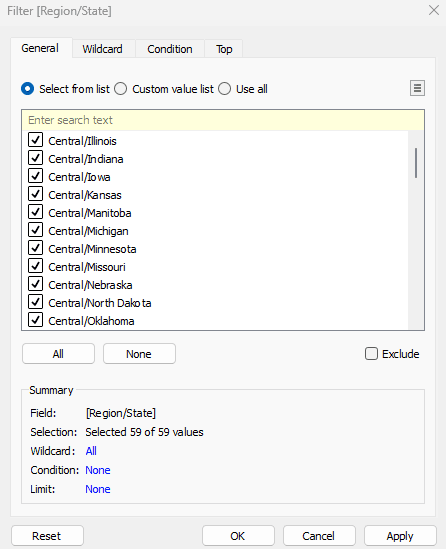
Right click on the Region/State pill in Filters, and click Show Filter. To the right, click on the Filter's dropdown to change it to a Multiple Values dropdown.
Now, grab the Customer name field to drag onto Rows, and grab the Sales field to drag it onto Text.
We want to format our Sales numbers to look like currency with 2 decimal places. Right click on the SUM(Sales) pill in the Marks card, go to Format, under Default go to Numbers, and choose Currency (Standard). Close the Format pane to the left.
Click on the down arrow for the Region/State filter, go to Format Filter and Set Controls, then under Body choose a shading. Close the Format pane.
Name this sheet Customer Sales by Region/State.
Sales Aggregates
Create a new sheet and name it Sales Aggregates.
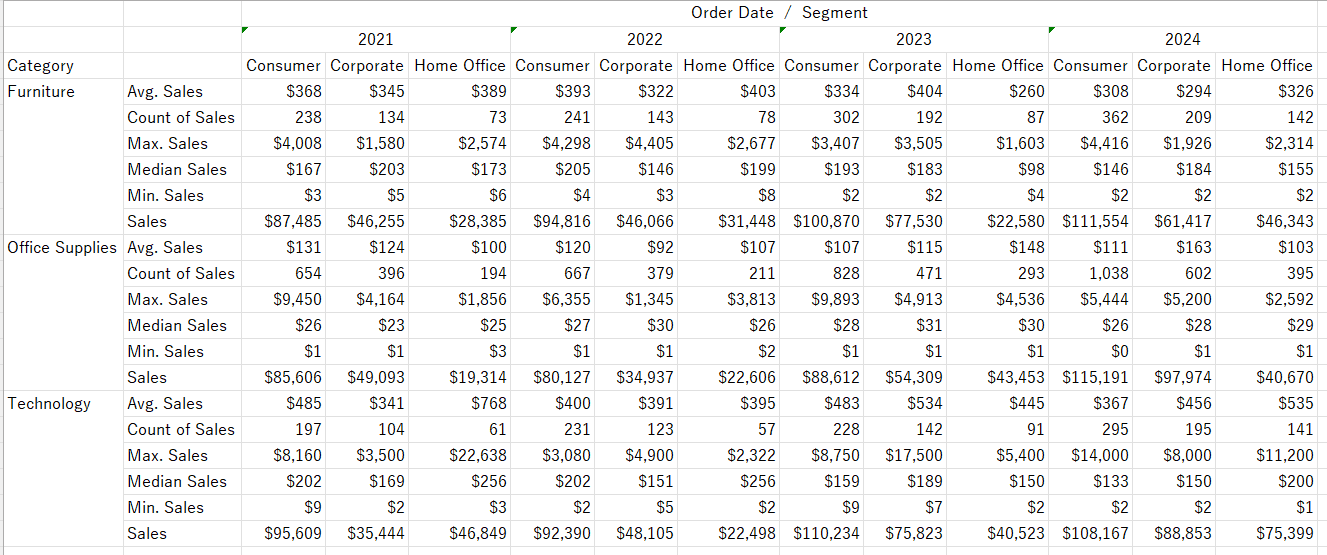
Add Segment to Columns, Sales to Rows six times, and category to Color on the Marks card.
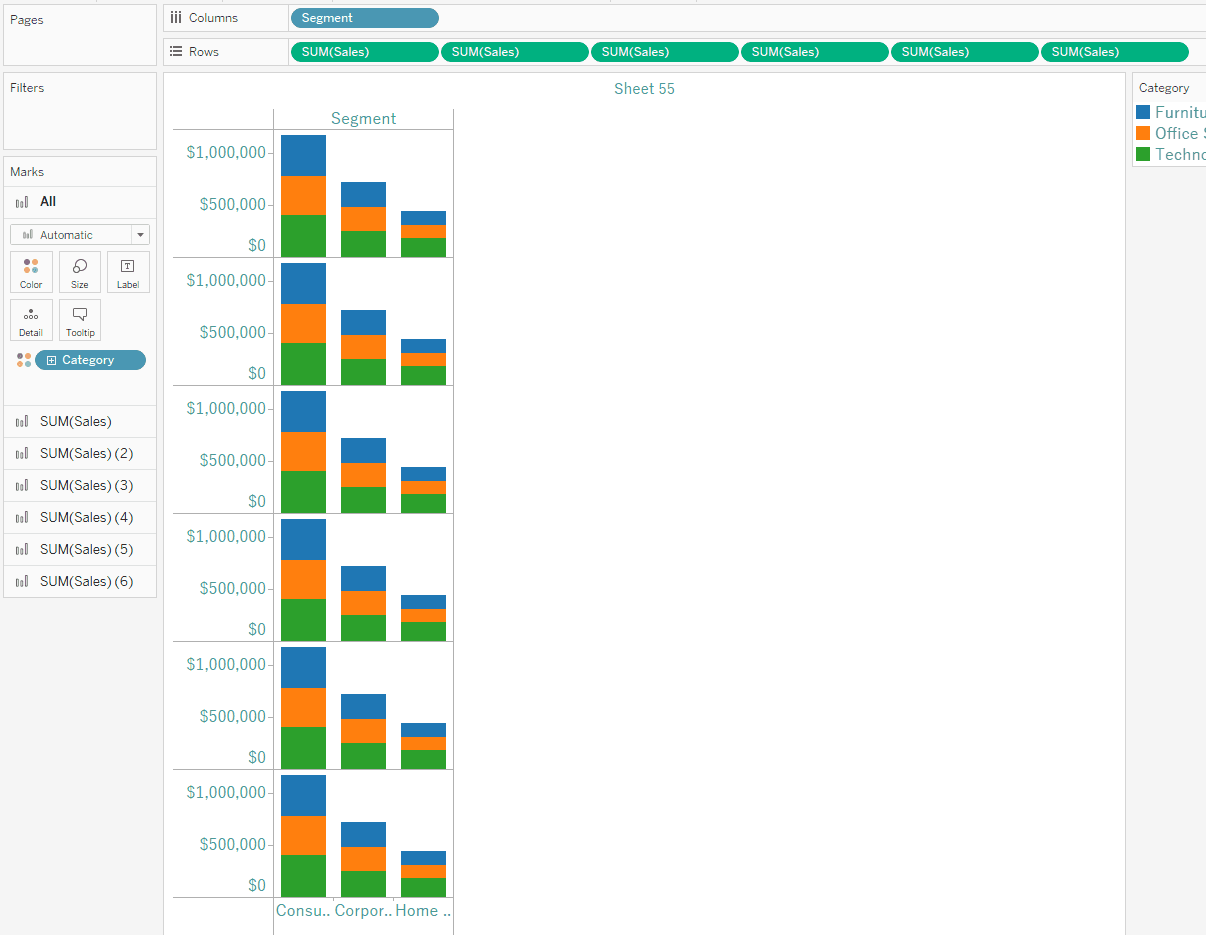
For the second SUM(Sales) pill, click on the arrow dropdown and change the measure to Average.
For the third one, go back to the dropdown and change the measure to Median.
The fourth one, change to the Count.
The fifth one, change to the Maximum.
For the sixth one, change to the Minimum.
Add Order Date to Columns, in front of Segment.
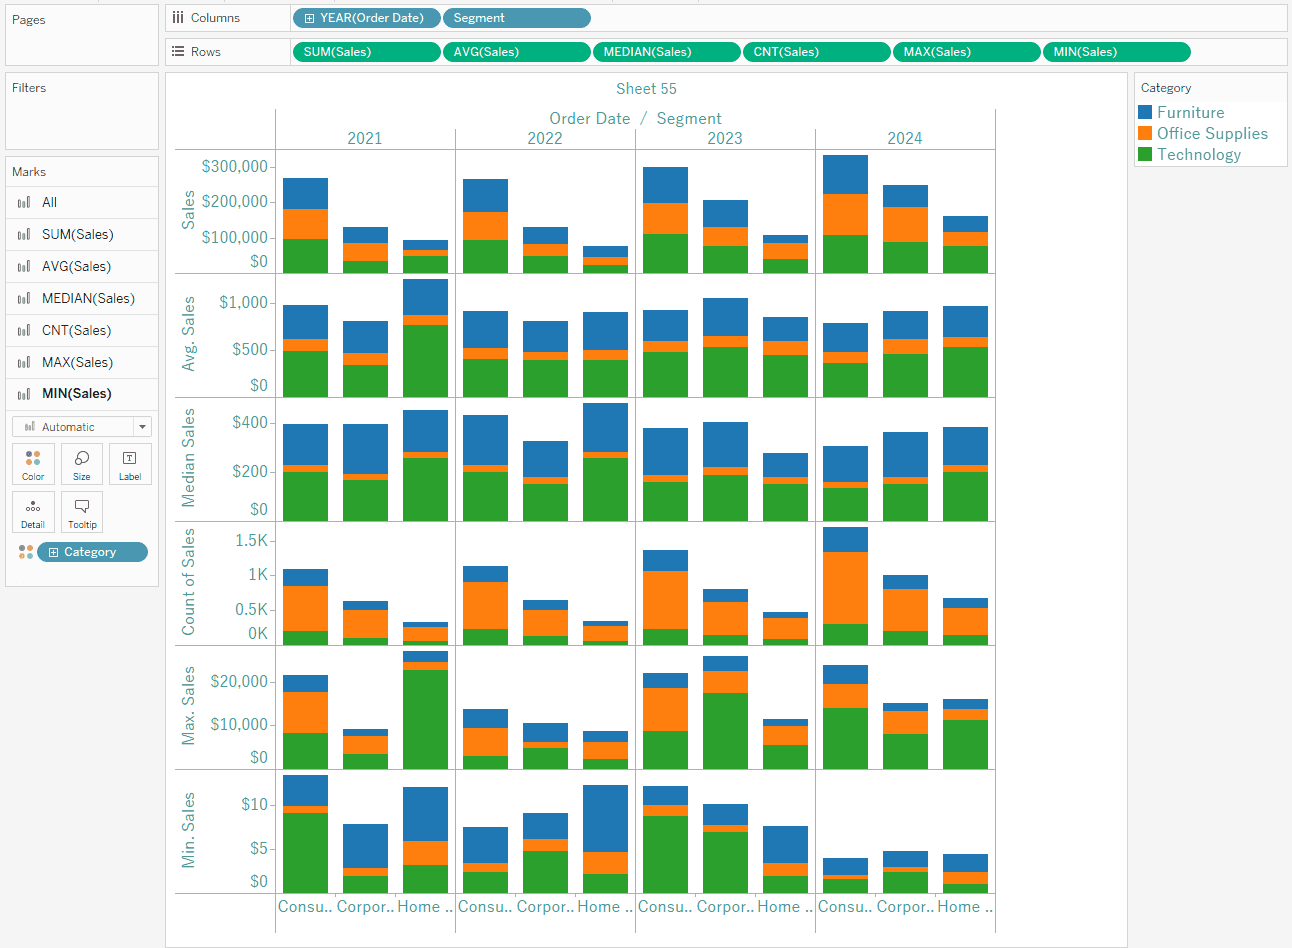
So now, click on the Worksheet tab, hover over Export, and choose Crosstab to Excel.
Blending data
Blends, unlike relationships or joins, never truly combine the data. Instead, blends query each data source independently, the results are aggregated to the appropriate level, then the results are presented visually together in the view. Because of this, blends can handle different levels of detail and working with published data sources. Blends are also established individually on every sheet and can never be published, because there is no true "blended data source", simply blended results from multiple data sources in a visualization. Data blending is particularly useful when the blend relationship - linking fields - need to vary on a sheet-by-sheet basis, or when combining published data sources.
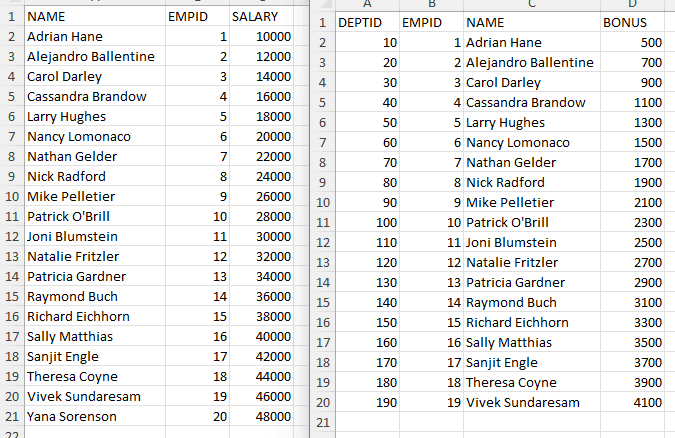
Let's say we had two Excel files that we wanted to blend, so that we could use fields from each file in the same visualization.
Save your Sample Superstore, and then go File > Close.
In the Home page, click on Microsoft Excel, then open your first file that you want to blend. It will open the Data Source view. Navigate to Sheet one.
Drag and drop a field into Rows.
Open the Data tab up the top, choose New data source, Microsoft Excel, and choose your second file. Go back to Sheet one.
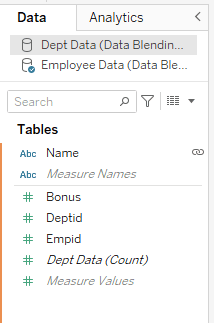
Up the top we can see that we have two different data sources. To the right of the Name field you'll see a link icon - this means we are blending the two sources based on the name field.
Drag a field to Rows.

Open the Show Me button, and choose the Text Table option.
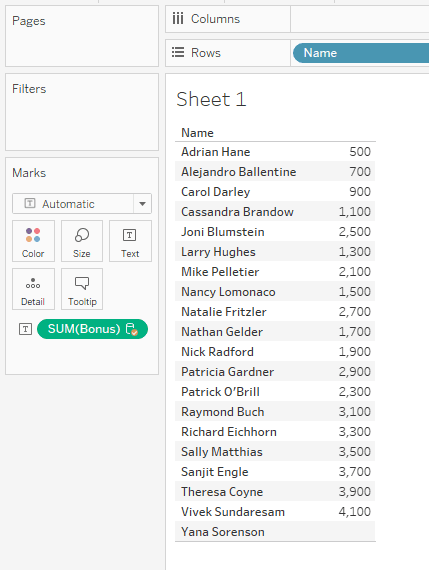
Click on your first data source in the Data pane and add a field to the table. Go back to your second data source and add a couple more fields.
You can rearrange your columns by clicking and dragging on the table.
You can remove a row by right clicking on one and choosing Exclude.
Name your sheet Data Blending. Save the workbook with the same name.
Optimizing
Reduce the Scope: the fewer sheets and data sources, the faster your viz will perform.
Limit the # of Filters: each filter in the view requires a query in order to populate the options. If you add a lot of interactive filters, it can cause the dashboard to take a long time to render.
Reduce the # of marks: More marks mean more processing power and memory to render. Keep in mind that too many data points can reduce the visual analytics value by causing info overload. To avoid this, compile related views and connect them with action filters so you can go from an overview to a more granular view as you explore data. Also, remove any unneeded dimensions from the Detail shelf.
In Tableau, open the Sample Superstore workbook.
Customer Sales by Region/State
The first thing we want to do is learn how to concatenate. We want to put the region and the state together. Click on the down arrow next to the search bar to the left, and choose Create Calculated Field.
Insert this below. Here we are saying concatenate Region and State/Province with a slash. Click OK.

Now we want to grab the Region/State field we just created, and we want to add it to the hierarchy of Location.
Hover over Region/State and click on its down arrow, hover over Hierarchy, Add to Hierarchy, and choose Location. Once it's in the hierarchy, drag it up so that it's right below Region.
Let's drag Region/State to the Filters shelf, select All, then click OK.

Right click on the Region/State pill in Filters, and click Show Filter. To the right, click on the Filter's dropdown to change it to a Multiple Values dropdown.
Now, grab the Customer name field to drag onto Rows, and grab the Sales field to drag it onto Text.
We want to format our Sales numbers to look like currency with 2 decimal places. Right click on the SUM(Sales) pill in the Marks card, go to Format, under Default go to Numbers, and choose Currency (Standard). Close the Format pane to the left.
Click on the down arrow for the Region/State filter, go to Format Filter and Set Controls, then under Body choose a shading. Close the Format pane.
Name this sheet Customer Sales by Region/State.
Sales Aggregates
Create a new sheet and name it Sales Aggregates.
Add Segment to Columns, Sales to Rows six times, and category to Color on the Marks card.

For the second SUM(Sales) pill, click on the arrow dropdown and change the measure to Average.
For the third one, go back to the dropdown and change the measure to Median.
The fourth one, change to the Count.
The fifth one, change to the Maximum.
For the sixth one, change to the Minimum.
Add Order Date to Columns, in front of Segment.

So now, click on the Worksheet tab, hover over Export, and choose Crosstab to Excel.

Blending data
Blends, unlike relationships or joins, never truly combine the data. Instead, blends query each data source independently, the results are aggregated to the appropriate level, then the results are presented visually together in the view. Because of this, blends can handle different levels of detail and working with published data sources. Blends are also established individually on every sheet and can never be published, because there is no true "blended data source", simply blended results from multiple data sources in a visualization. Data blending is particularly useful when the blend relationship - linking fields - need to vary on a sheet-by-sheet basis, or when combining published data sources.
Let's say we had two Excel files that we wanted to blend, so that we could use fields from each file in the same visualization.

Save your Sample Superstore, and then go File > Close.
In the Home page, click on Microsoft Excel, then open your first file that you want to blend. It will open the Data Source view. Navigate to Sheet one.
Drag and drop a field into Rows.
Open the Data tab up the top, choose New data source, Microsoft Excel, and choose your second file. Go back to Sheet one.

Up the top we can see that we have two different data sources. To the right of the Name field you'll see a link icon - this means we are blending the two sources based on the name field.
Drag a field to Rows.

Open the Show Me button, and choose the Text Table option.

Click on your first data source in the Data pane and add a field to the table. Go back to your second data source and add a couple more fields.
You can rearrange your columns by clicking and dragging on the table.
You can remove a row by right clicking on one and choosing Exclude.
Name your sheet Data Blending. Save the workbook with the same name.
Optimizing
Reduce the Scope: the fewer sheets and data sources, the faster your viz will perform.
Limit the # of Filters: each filter in the view requires a query in order to populate the options. If you add a lot of interactive filters, it can cause the dashboard to take a long time to render.
Reduce the # of marks: More marks mean more processing power and memory to render. Keep in mind that too many data points can reduce the visual analytics value by causing info overload. To avoid this, compile related views and connect them with action filters so you can go from an overview to a more granular view as you explore data. Also, remove any unneeded dimensions from the Detail shelf.
In Tableau, open the Sample Superstore workbook.
Customer Sales by Region/State
The first thing we want to do is learn how to concatenate. We want to put the region and the state together. Click on the down arrow next to the search bar to the left, and choose Create Calculated Field.
Insert this below. Here we are saying concatenate Region and State/Province with a slash. Click OK.

Now we want to grab the Region/State field we just created, and we want to add it to the hierarchy of Location.
Hover over Region/State and click on its down arrow, hover over Hierarchy, Add to Hierarchy, and choose Location. Once it's in the hierarchy, drag it up so that it's right below Region.
Let's drag Region/State to the Filters shelf, select All, then click OK.

Right click on the Region/State pill in Filters, and click Show Filter. To the right, click on the Filter's dropdown to change it to a Multiple Values dropdown.
Now, grab the Customer name field to drag onto Rows, and grab the Sales field to drag it onto Text.
We want to format our Sales numbers to look like currency with 2 decimal places. Right click on the SUM(Sales) pill in the Marks card, go to Format, under Default go to Numbers, and choose Currency (Standard). Close the Format pane to the left.
Click on the down arrow for the Region/State filter, go to Format Filter and Set Controls, then under Body choose a shading. Close the Format pane.
Name this sheet Customer Sales by Region/State.
Sales Aggregates
Create a new sheet and name it Sales Aggregates.
Add Segment to Columns, Sales to Rows six times, and category to Color on the Marks card.

For the second SUM(Sales) pill, click on the arrow dropdown and change the measure to Average.
For the third one, go back to the dropdown and change the measure to Median.
The fourth one, change to the Count.
The fifth one, change to the Maximum.
For the sixth one, change to the Minimum.
Add Order Date to Columns, in front of Segment.

So now, click on the Worksheet tab, hover over Export, and choose Crosstab to Excel.

Blending data
Blends, unlike relationships or joins, never truly combine the data. Instead, blends query each data source independently, the results are aggregated to the appropriate level, then the results are presented visually together in the view. Because of this, blends can handle different levels of detail and working with published data sources. Blends are also established individually on every sheet and can never be published, because there is no true "blended data source", simply blended results from multiple data sources in a visualization. Data blending is particularly useful when the blend relationship - linking fields - need to vary on a sheet-by-sheet basis, or when combining published data sources.
Let's say we had two Excel files that we wanted to blend, so that we could use fields from each file in the same visualization.

Save your Sample Superstore, and then go File > Close.
In the Home page, click on Microsoft Excel, then open your first file that you want to blend. It will open the Data Source view. Navigate to Sheet one.
Drag and drop a field into Rows.
Open the Data tab up the top, choose New data source, Microsoft Excel, and choose your second file. Go back to Sheet one.

Up the top we can see that we have two different data sources. To the right of the Name field you'll see a link icon - this means we are blending the two sources based on the name field.
Drag a field to Rows.

Open the Show Me button, and choose the Text Table option.

Click on your first data source in the Data pane and add a field to the table. Go back to your second data source and add a couple more fields.
You can rearrange your columns by clicking and dragging on the table.
You can remove a row by right clicking on one and choosing Exclude.
Name your sheet Data Blending. Save the workbook with the same name.
Optimizing
Reduce the Scope: the fewer sheets and data sources, the faster your viz will perform.
Limit the # of Filters: each filter in the view requires a query in order to populate the options. If you add a lot of interactive filters, it can cause the dashboard to take a long time to render.
Reduce the # of marks: More marks mean more processing power and memory to render. Keep in mind that too many data points can reduce the visual analytics value by causing info overload. To avoid this, compile related views and connect them with action filters so you can go from an overview to a more granular view as you explore data. Also, remove any unneeded dimensions from the Detail shelf.
CONTENT
SHARE