CONTENT
4 useful Power BI visualizations that Excel doesn't offer
Learn how to enhance your Power BI reports with advanced visuals like ribbon charts, decomposition trees, scatter charts, and infographics.


Saartje Ly
Data Engineering Intern
May 5, 2024
#1 Ribbon chart
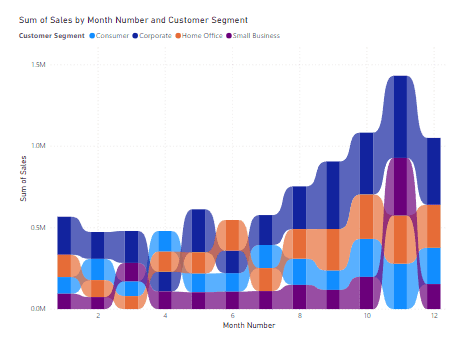
The ribbon chart is great for viewing data over time, and keeping track of rank changes.
Add a ribbon chart to your canvas, then add a date field to the X-axis to show the changes over time.
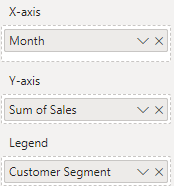
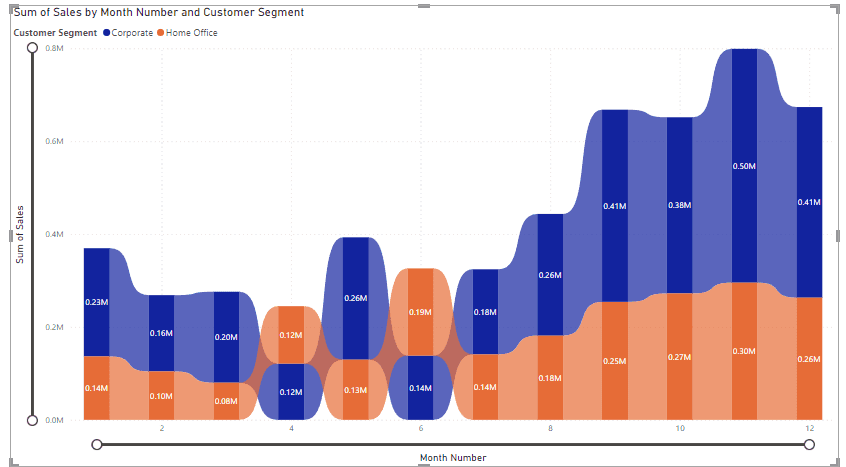
After adding a value to your Y-axis, you’ll notice that you have a bar chart visualization. The ribbons appear after you add a field to your legend box. Behind these ribbons you’ll see stacked columns for the different categories. The lighter colors in the ribbon show the rank changes.
Ribbon charts can be difficult to read. Let’s make some adjustments.
1. Turn on Data labels and activate the Zoom slider in Format visual

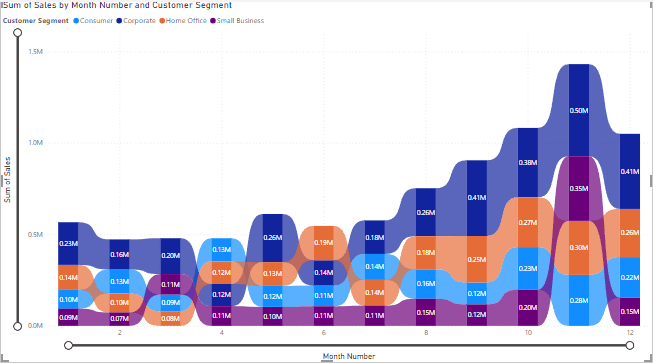
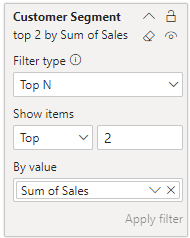
2. Let’s now look at the top categories for sum of sales. In the Filters pane, filter your field by Top N. Here we’d like to see the top 2 categories by Sum of Sales.
#2 Decomposition tree
This is an AI visual that lets you visualize data across multiple dimensions.
1. After adding the decomposition tree to your canvas, in the Visualizations pane drag and drop your fields to the Analyze and Explain by boxes.
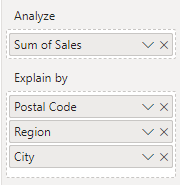
Notice the plus sign. Click this to choose how to split your data. The light bulb icon indicates an AI feature.
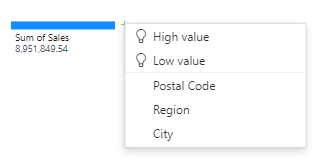
2. Choose Low value. The AI decides what category to show.
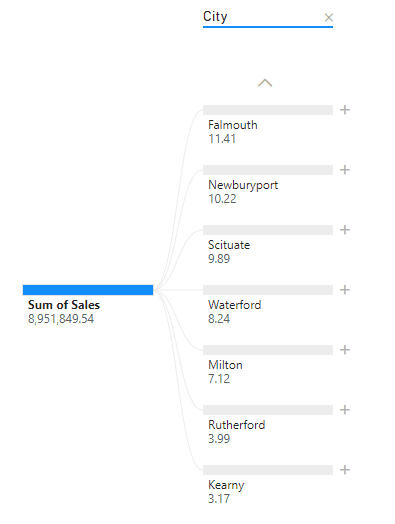
Here we can see the lowest sum of sales per City.
3. We will click on the plus icon next to the lowest City, and choose Low value again.
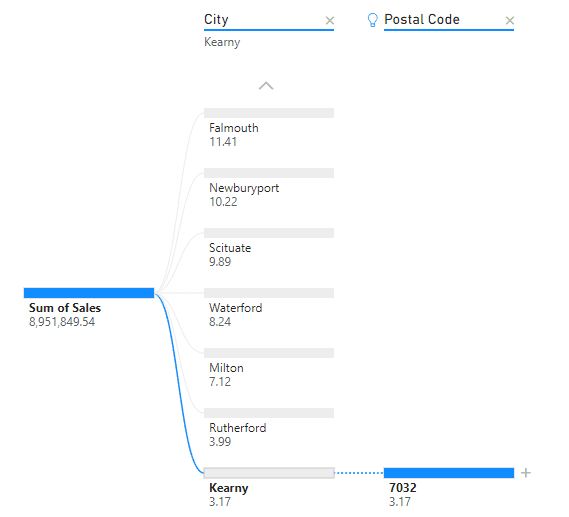
We are now given the Postal code of where this low Sum of sales value is coming from.
4. Click on the plus icon and select Low value again to reveal which Region.
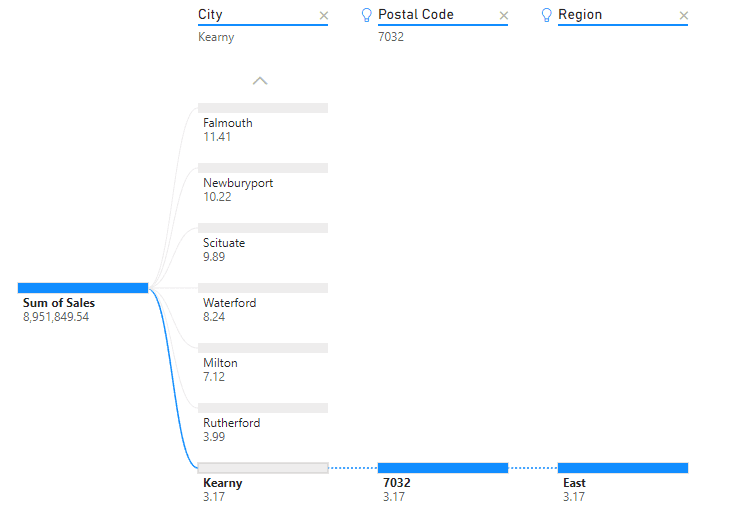
We can now apply this pattern to other cities.
5. Click on another City to view the corresponding Postal Code and Region of where the lowest Sum of Sale is coming from.
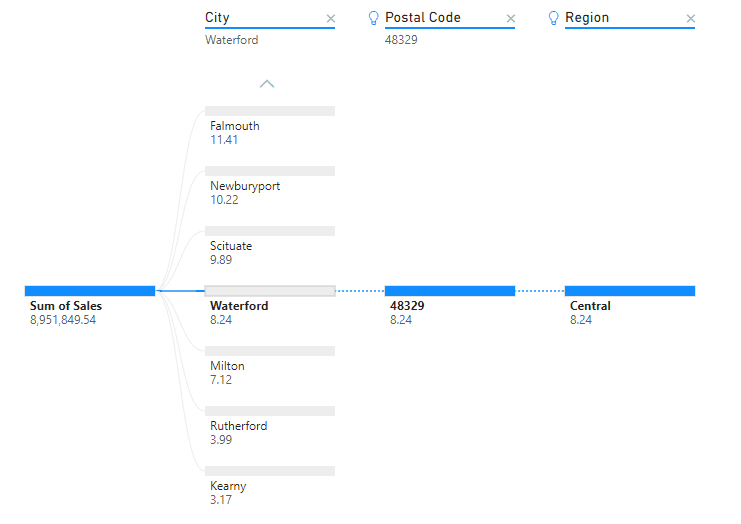
Start this process again to look for something else!
Click the X buttons next to the field names up the top, then press the plus icon next to Sum of Sales.
I'd like to view Region and City, to see which cities contribute how much to a region for Sum of Sales.
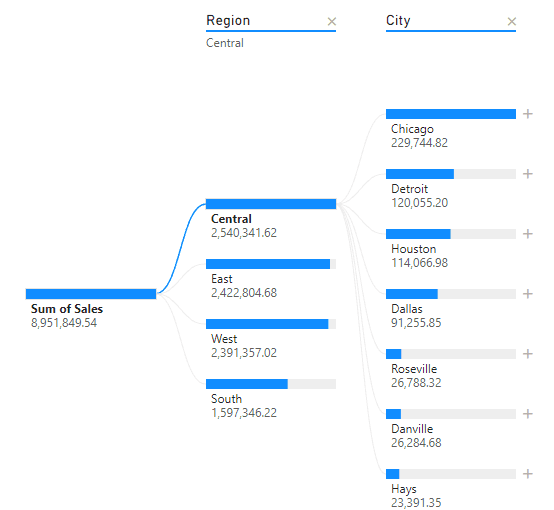
#3 Scatter chart
Excel does have a scatter chart, but it’s not as cool as Power BIs.
1. Add the scatter chart to your canvas, and populate the X-axis, Y-axis, and Size boxes in the Visualizations pane.
2. The Legend box represents what we split by. Add a field to this box.
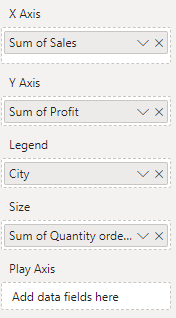
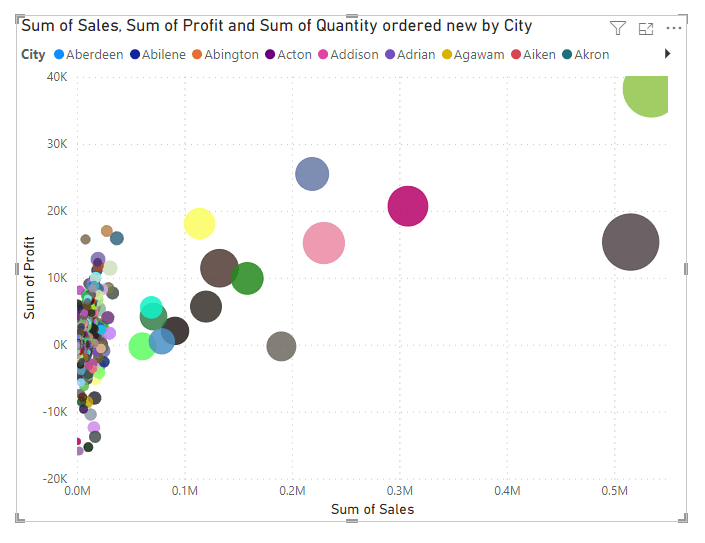
What makes this so different to Excel? We have a Play axis option.
3. Add a time factor to the Play axis box.
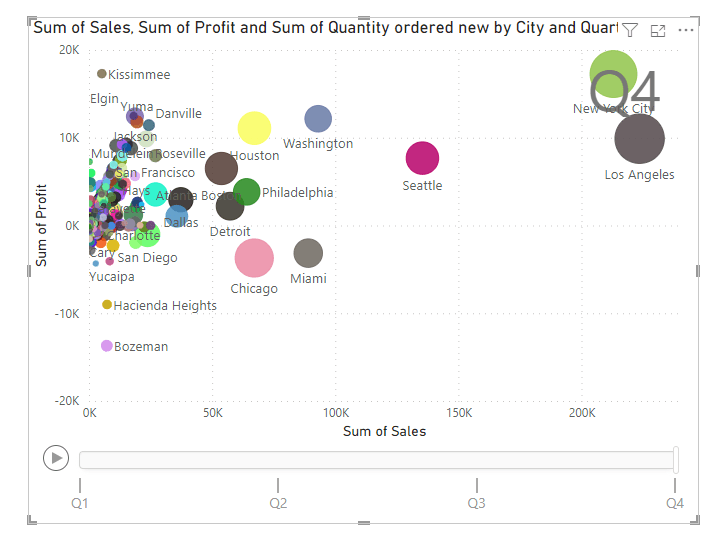
Here I have added Quarter to my Play axis box. I have also turned off Legend, and turned on Category label under Format visual in the Visualizations pane.
Click play on your visualization to understand the change over time.
#4 Infographics
The great thing about Power BI is that you aren’t restricted to the visualizations given, you can go and grab more visuals.
1. Click on the three dots down the bottom of the visuals, and click Get more visuals
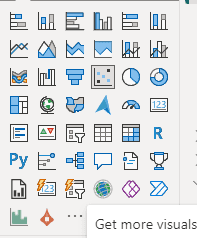
2. Search for Infographic Designer, click it, then click Add.
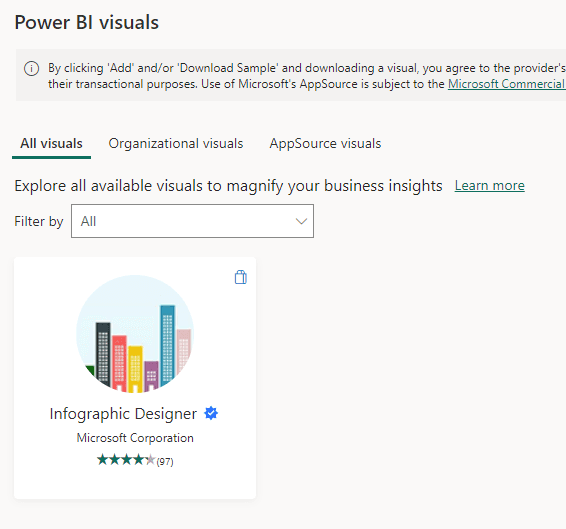
An icon for this newly added visualization can be seen under all the other visualization icons.
3. Add this visualization in, and populate with data.
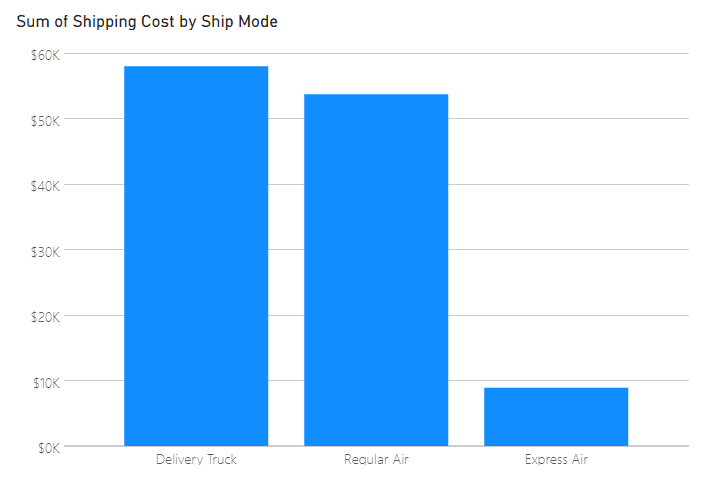
4. In your measure box, click the down arrow of the data inside, click Show value as, then click Percent as grand total.
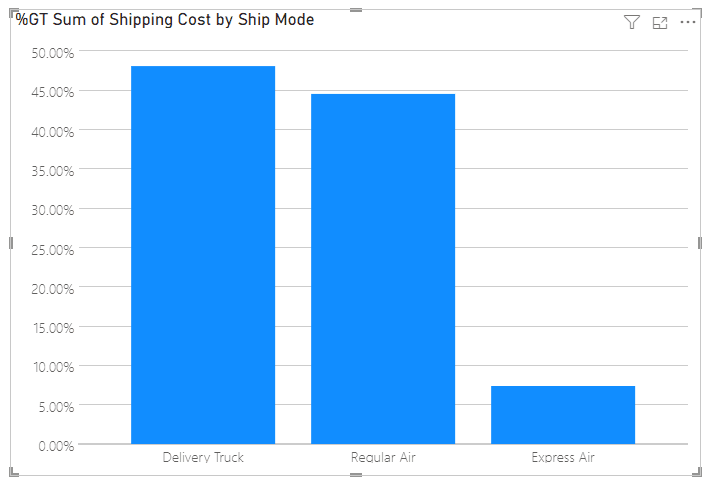
5. When you hover over your visualization, you’ll see a pencil icon. Click this.
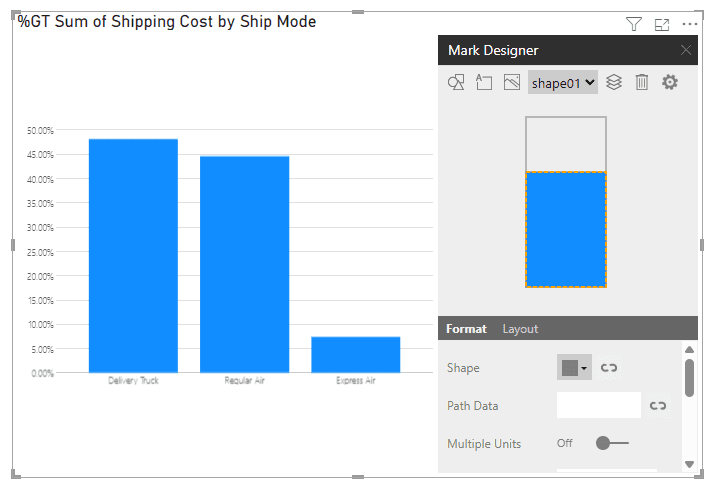
Here we get specific designer options.
6. Click the Data-Binding option next to the square in Shape
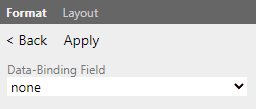
7. Change the Data-Binding field to the categorical value in your graph
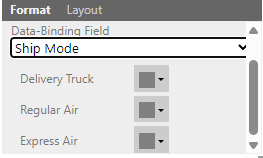
We can now change the shapes of the categories. Click Apply when finished.
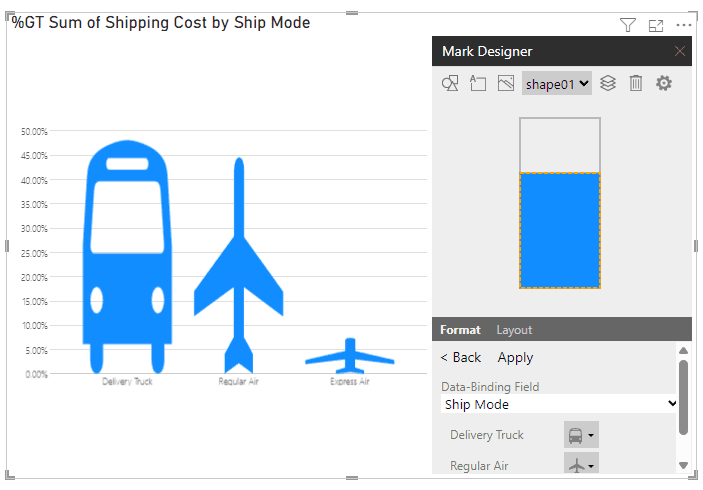
We want them to be the same height.
8. Head to Layout, then change Bound to, to Outer.
9. Go back to Format. We want to fill the shapes based on their percentage. Change Fill percentage to the percentage field, and of to 1. The 1 represents the relative proportion to each other. Think of it as the sum of all proportions adding to 1.
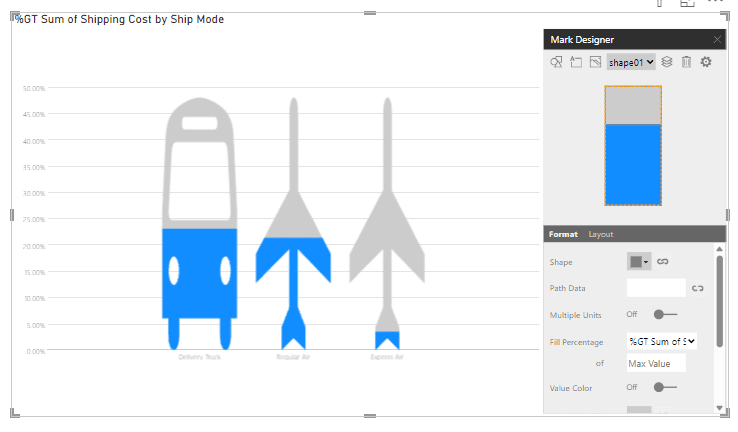
10. Change the color of your fill if necessary in Format.
11. Now, let’s add the actual percentage to each category. Click the Insert text button up the top.
12. We want the text to be dynamic, so click the Data-Binding button next to Text. There should be a Data-Binding option for your percentage field. Apply this change.
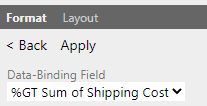
You can apply formatting to the text back in Format.
13. Finally, let’s remove the axes from the visualization. In the Visualizations pane under Chart, untick the X-axis and Y-axis.

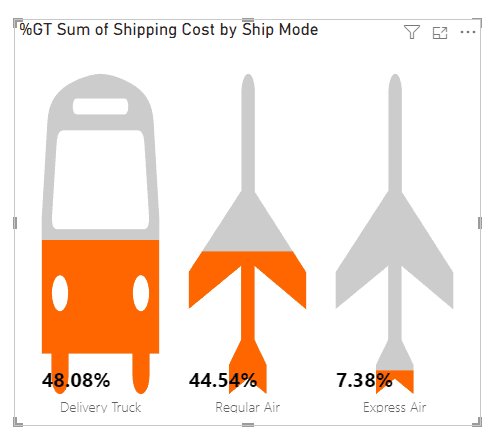
NOTE: I’m keeping the X-axis label on here to distinguish between Regular Air and Express Air.
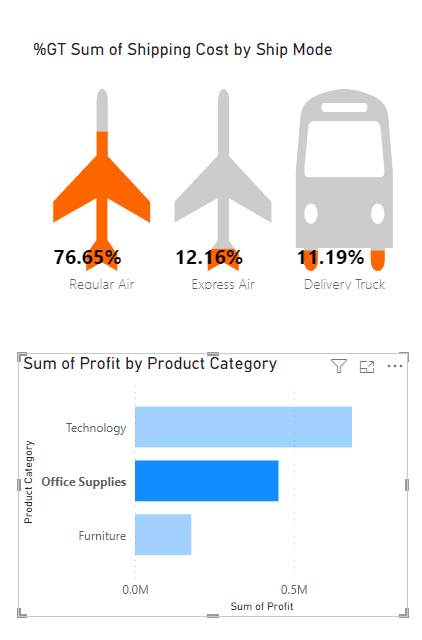
The great thing about this is that it works similar to other Power BI graphs. You can cross highlight and cross filter.
Let’s say we had a bar chart in place. When we select a category in the bar chart, it filters our infographic based on what’s selected.
#1 Ribbon chart

The ribbon chart is great for viewing data over time, and keeping track of rank changes.
Add a ribbon chart to your canvas, then add a date field to the X-axis to show the changes over time.

After adding a value to your Y-axis, you’ll notice that you have a bar chart visualization. The ribbons appear after you add a field to your legend box. Behind these ribbons you’ll see stacked columns for the different categories. The lighter colors in the ribbon show the rank changes.
Ribbon charts can be difficult to read. Let’s make some adjustments.
1. Turn on Data labels and activate the Zoom slider in Format visual


2. Let’s now look at the top categories for sum of sales. In the Filters pane, filter your field by Top N. Here we’d like to see the top 2 categories by Sum of Sales.


#2 Decomposition tree
This is an AI visual that lets you visualize data across multiple dimensions.
1. After adding the decomposition tree to your canvas, in the Visualizations pane drag and drop your fields to the Analyze and Explain by boxes.

Notice the plus sign. Click this to choose how to split your data. The light bulb icon indicates an AI feature.

2. Choose Low value. The AI decides what category to show.

Here we can see the lowest sum of sales per City.
3. We will click on the plus icon next to the lowest City, and choose Low value again.

We are now given the Postal code of where this low Sum of sales value is coming from.
4. Click on the plus icon and select Low value again to reveal which Region.

We can now apply this pattern to other cities.
5. Click on another City to view the corresponding Postal Code and Region of where the lowest Sum of Sale is coming from.

Start this process again to look for something else!
Click the X buttons next to the field names up the top, then press the plus icon next to Sum of Sales.
I'd like to view Region and City, to see which cities contribute how much to a region for Sum of Sales.

#3 Scatter chart
Excel does have a scatter chart, but it’s not as cool as Power BIs.
1. Add the scatter chart to your canvas, and populate the X-axis, Y-axis, and Size boxes in the Visualizations pane.
2. The Legend box represents what we split by. Add a field to this box.


What makes this so different to Excel? We have a Play axis option.
3. Add a time factor to the Play axis box.

Here I have added Quarter to my Play axis box. I have also turned off Legend, and turned on Category label under Format visual in the Visualizations pane.
Click play on your visualization to understand the change over time.
#4 Infographics
The great thing about Power BI is that you aren’t restricted to the visualizations given, you can go and grab more visuals.
1. Click on the three dots down the bottom of the visuals, and click Get more visuals

2. Search for Infographic Designer, click it, then click Add.


An icon for this newly added visualization can be seen under all the other visualization icons.
3. Add this visualization in, and populate with data.

4. In your measure box, click the down arrow of the data inside, click Show value as, then click Percent as grand total.

5. When you hover over your visualization, you’ll see a pencil icon. Click this.

Here we get specific designer options.
6. Click the Data-Binding option next to the square in Shape

7. Change the Data-Binding field to the categorical value in your graph

We can now change the shapes of the categories. Click Apply when finished.

We want them to be the same height.
8. Head to Layout, then change Bound to, to Outer.
9. Go back to Format. We want to fill the shapes based on their percentage. Change Fill percentage to the percentage field, and of to 1. The 1 represents the relative proportion to each other. Think of it as the sum of all proportions adding to 1.

10. Change the color of your fill if necessary in Format.
11. Now, let’s add the actual percentage to each category. Click the Insert text button up the top.
12. We want the text to be dynamic, so click the Data-Binding button next to Text. There should be a Data-Binding option for your percentage field. Apply this change.

You can apply formatting to the text back in Format.
13. Finally, let’s remove the axes from the visualization. In the Visualizations pane under Chart, untick the X-axis and Y-axis.


NOTE: I’m keeping the X-axis label on here to distinguish between Regular Air and Express Air.
The great thing about this is that it works similar to other Power BI graphs. You can cross highlight and cross filter.
Let’s say we had a bar chart in place. When we select a category in the bar chart, it filters our infographic based on what’s selected.

#1 Ribbon chart

The ribbon chart is great for viewing data over time, and keeping track of rank changes.
Add a ribbon chart to your canvas, then add a date field to the X-axis to show the changes over time.

After adding a value to your Y-axis, you’ll notice that you have a bar chart visualization. The ribbons appear after you add a field to your legend box. Behind these ribbons you’ll see stacked columns for the different categories. The lighter colors in the ribbon show the rank changes.
Ribbon charts can be difficult to read. Let’s make some adjustments.
1. Turn on Data labels and activate the Zoom slider in Format visual


2. Let’s now look at the top categories for sum of sales. In the Filters pane, filter your field by Top N. Here we’d like to see the top 2 categories by Sum of Sales.


#2 Decomposition tree
This is an AI visual that lets you visualize data across multiple dimensions.
1. After adding the decomposition tree to your canvas, in the Visualizations pane drag and drop your fields to the Analyze and Explain by boxes.

Notice the plus sign. Click this to choose how to split your data. The light bulb icon indicates an AI feature.

2. Choose Low value. The AI decides what category to show.

Here we can see the lowest sum of sales per City.
3. We will click on the plus icon next to the lowest City, and choose Low value again.

We are now given the Postal code of where this low Sum of sales value is coming from.
4. Click on the plus icon and select Low value again to reveal which Region.

We can now apply this pattern to other cities.
5. Click on another City to view the corresponding Postal Code and Region of where the lowest Sum of Sale is coming from.

Start this process again to look for something else!
Click the X buttons next to the field names up the top, then press the plus icon next to Sum of Sales.
I'd like to view Region and City, to see which cities contribute how much to a region for Sum of Sales.

#3 Scatter chart
Excel does have a scatter chart, but it’s not as cool as Power BIs.
1. Add the scatter chart to your canvas, and populate the X-axis, Y-axis, and Size boxes in the Visualizations pane.
2. The Legend box represents what we split by. Add a field to this box.


What makes this so different to Excel? We have a Play axis option.
3. Add a time factor to the Play axis box.

Here I have added Quarter to my Play axis box. I have also turned off Legend, and turned on Category label under Format visual in the Visualizations pane.
Click play on your visualization to understand the change over time.
#4 Infographics
The great thing about Power BI is that you aren’t restricted to the visualizations given, you can go and grab more visuals.
1. Click on the three dots down the bottom of the visuals, and click Get more visuals

2. Search for Infographic Designer, click it, then click Add.


An icon for this newly added visualization can be seen under all the other visualization icons.
3. Add this visualization in, and populate with data.

4. In your measure box, click the down arrow of the data inside, click Show value as, then click Percent as grand total.

5. When you hover over your visualization, you’ll see a pencil icon. Click this.

Here we get specific designer options.
6. Click the Data-Binding option next to the square in Shape

7. Change the Data-Binding field to the categorical value in your graph

We can now change the shapes of the categories. Click Apply when finished.

We want them to be the same height.
8. Head to Layout, then change Bound to, to Outer.
9. Go back to Format. We want to fill the shapes based on their percentage. Change Fill percentage to the percentage field, and of to 1. The 1 represents the relative proportion to each other. Think of it as the sum of all proportions adding to 1.

10. Change the color of your fill if necessary in Format.
11. Now, let’s add the actual percentage to each category. Click the Insert text button up the top.
12. We want the text to be dynamic, so click the Data-Binding button next to Text. There should be a Data-Binding option for your percentage field. Apply this change.

You can apply formatting to the text back in Format.
13. Finally, let’s remove the axes from the visualization. In the Visualizations pane under Chart, untick the X-axis and Y-axis.


NOTE: I’m keeping the X-axis label on here to distinguish between Regular Air and Express Air.
The great thing about this is that it works similar to other Power BI graphs. You can cross highlight and cross filter.
Let’s say we had a bar chart in place. When we select a category in the bar chart, it filters our infographic based on what’s selected.

CONTENT
SHARE