CONTENT
Tableau: Table Calculations
Explore quick table calculations in Tableau: direction, differences, pane calculations, dimensions, and secondary calculations using Sample Superstore.


Saartje Ly
Data Engineering Intern
July 1, 2024
Introduction
Table calculations allow you to transform values at the level of detail of the visualization only.
Quick table calculations allow you to quickly apply a common table calculation to your visualization using the most typical settings for that calculation type.
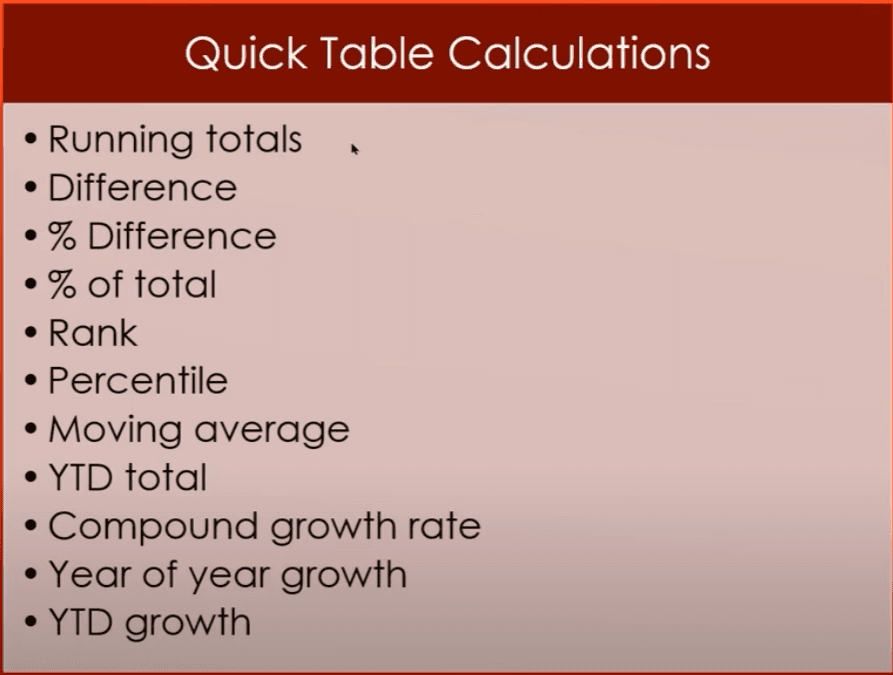
Make sure you are have open the Sample Superstore workbook in Tableau.
Direction
Table across computes across the length of the table and restarts after every partition. It will go across and perform the calculation then it will go down to the next row and perform the calculation.
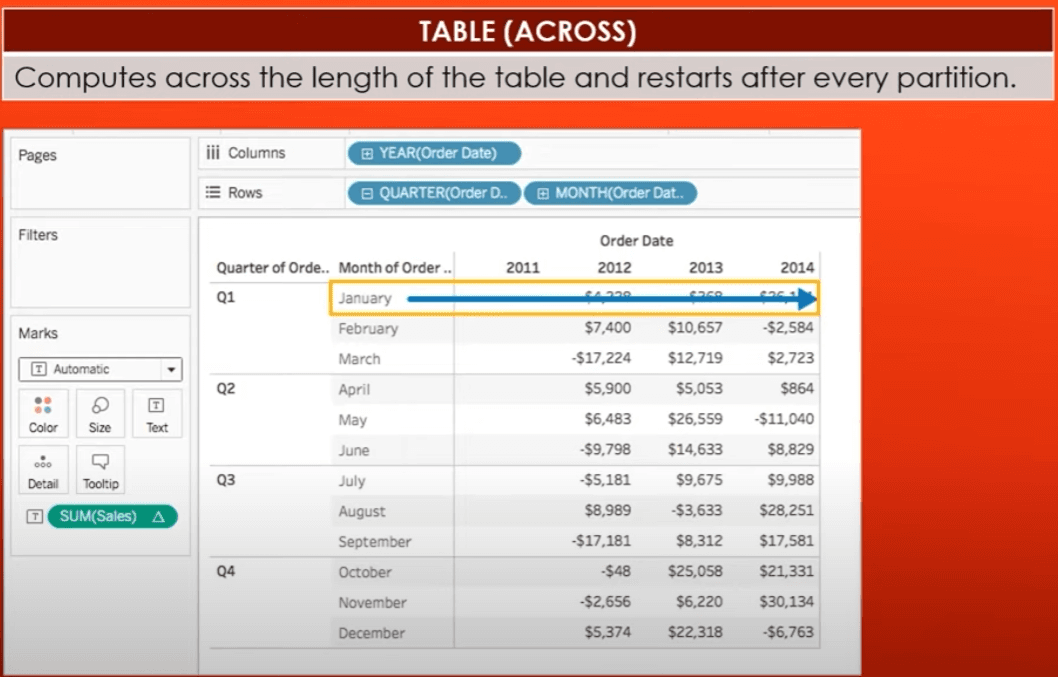
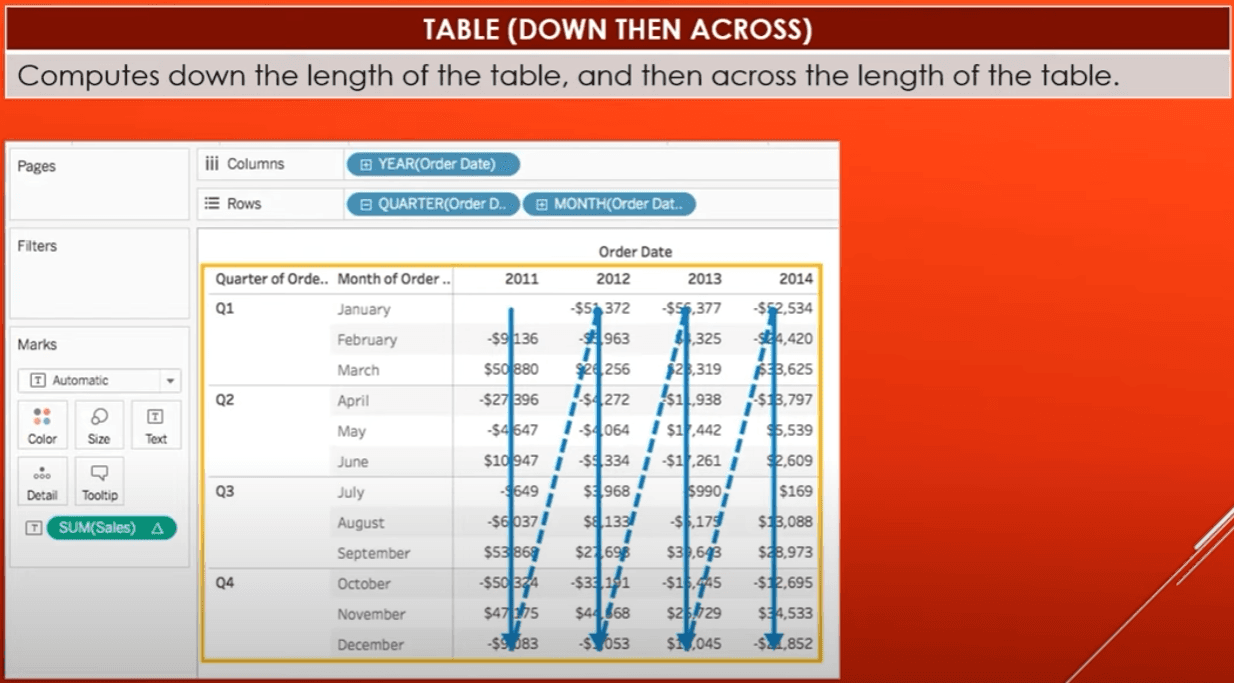
Table down computes down the length of the table and restarts after every partition. It will use the computation for all of 2011, then it will start over again for all of 2012.
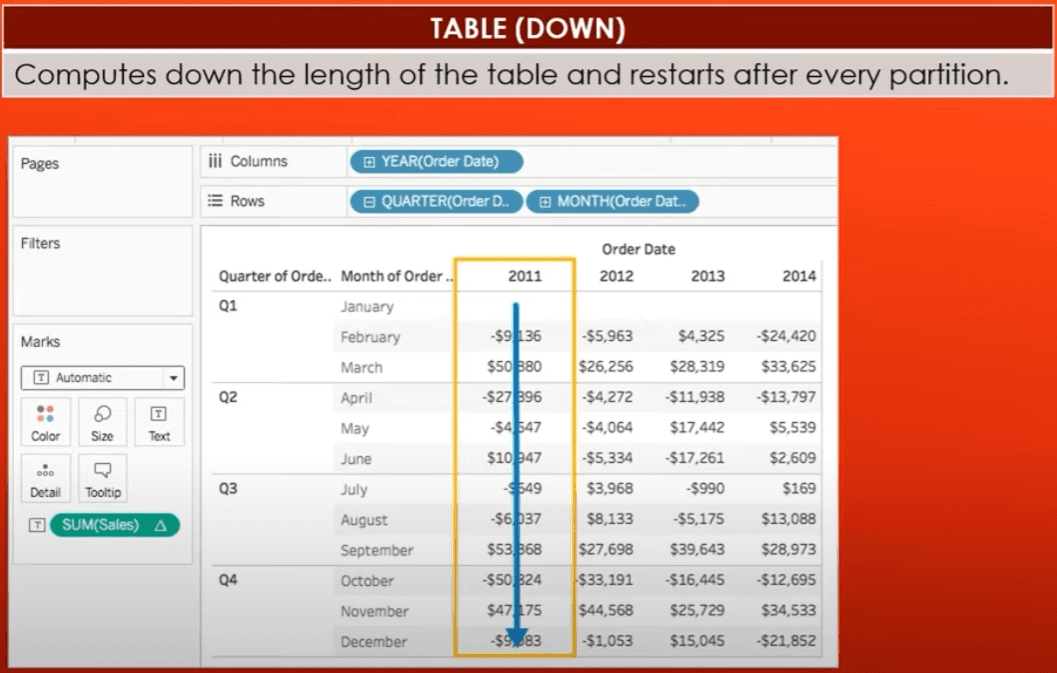
Table across then down will go all the way across January then it will go down and across February, and it will keep going across then down the length of the table.
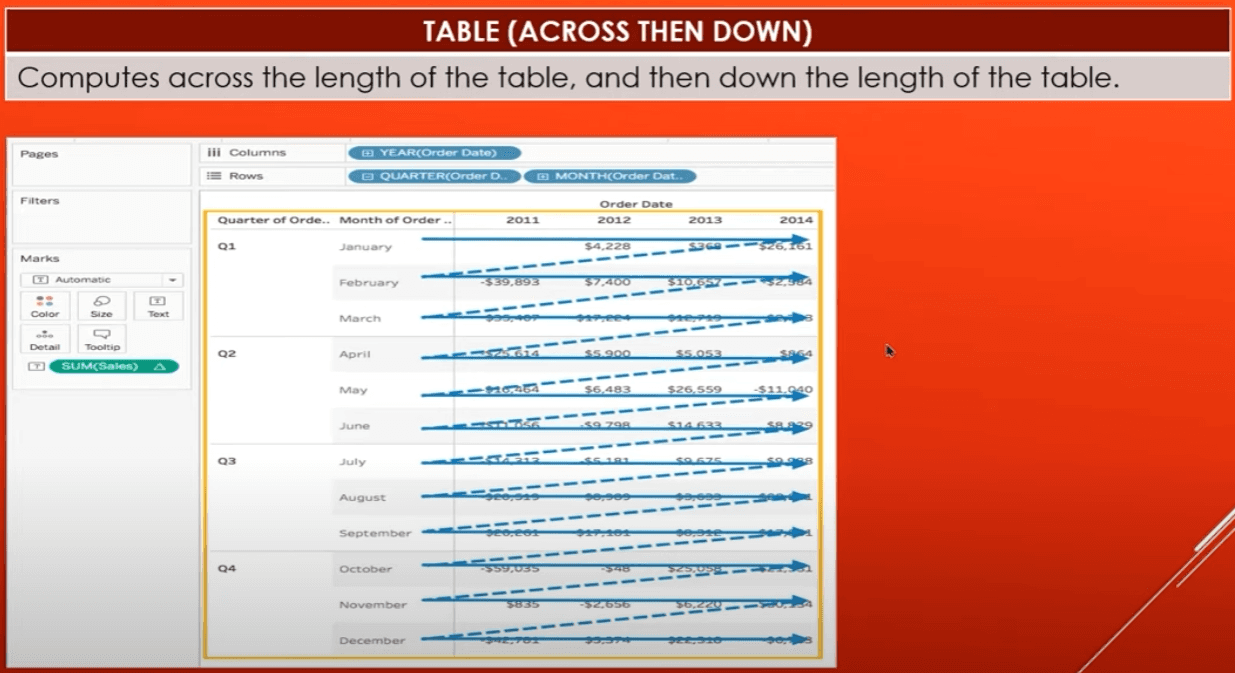
Table down then across goes down 2011, then across to 2012 and down so on and so forth.
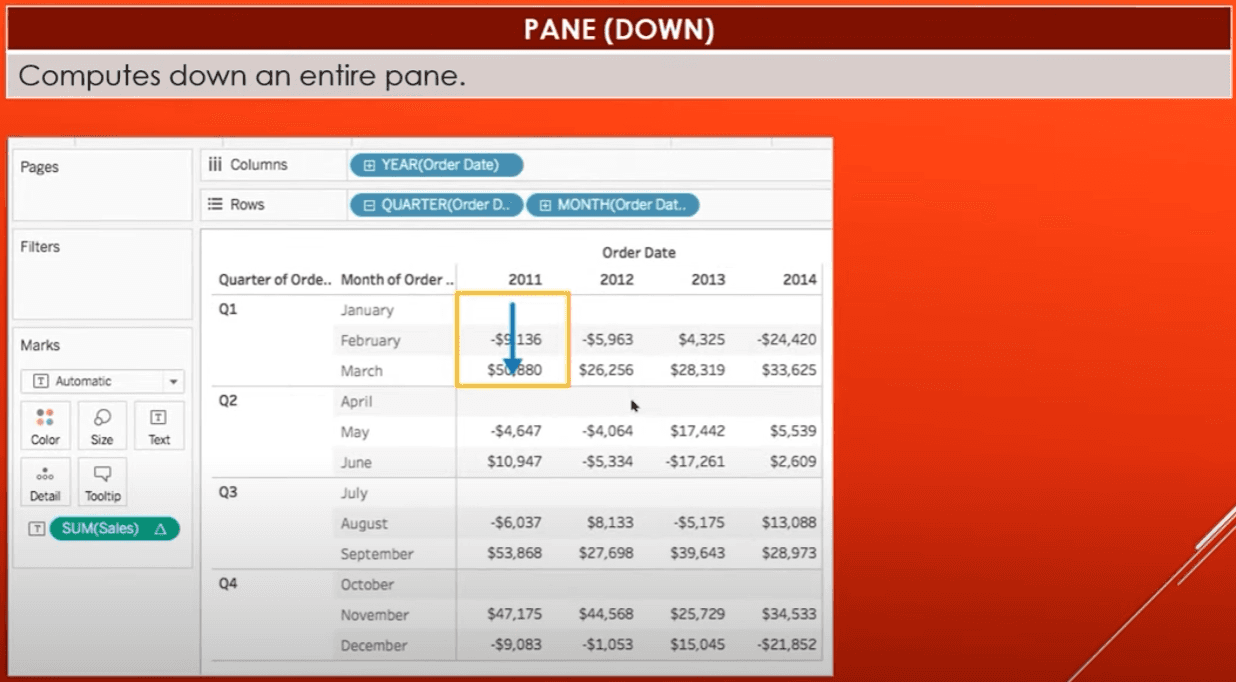
Pane down.
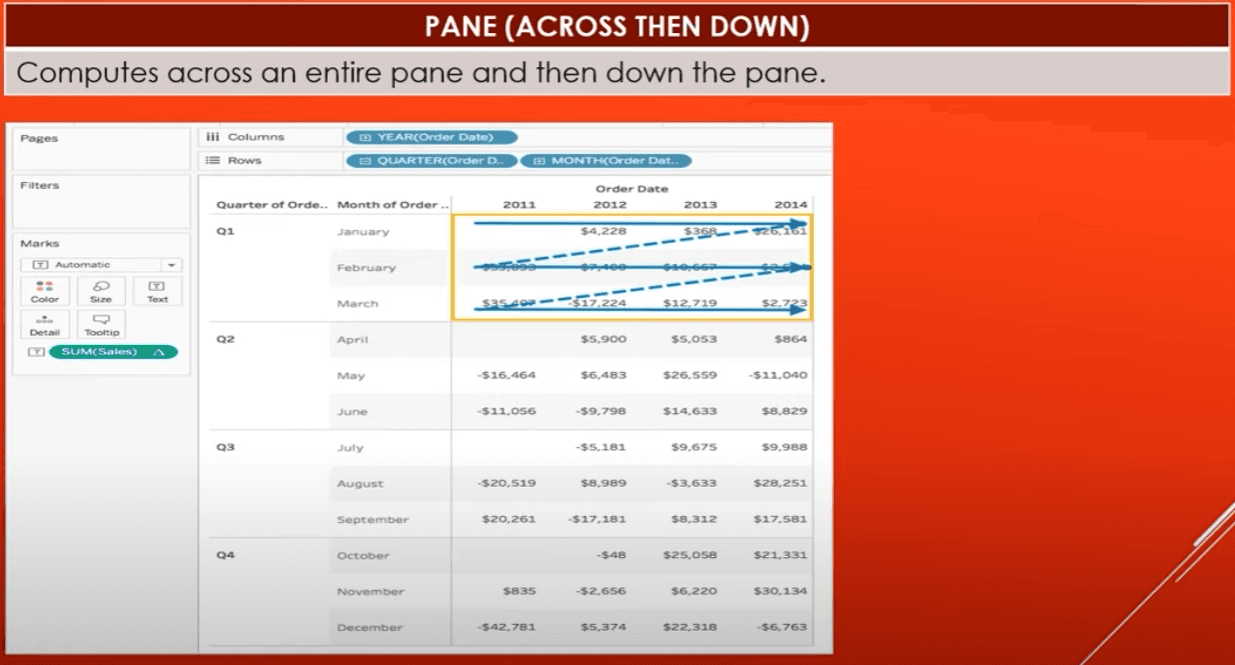
Pane across then down goes across the entire pane then down the entire pane before moving to the next pane.
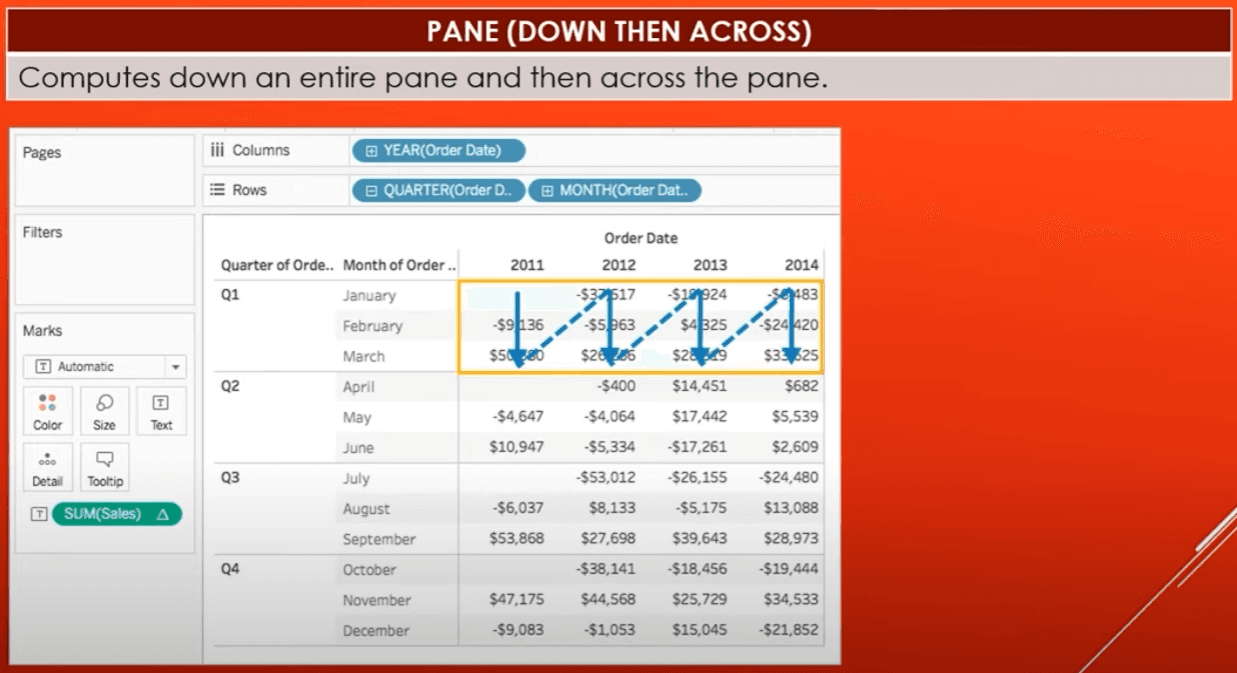
Pane down then across.
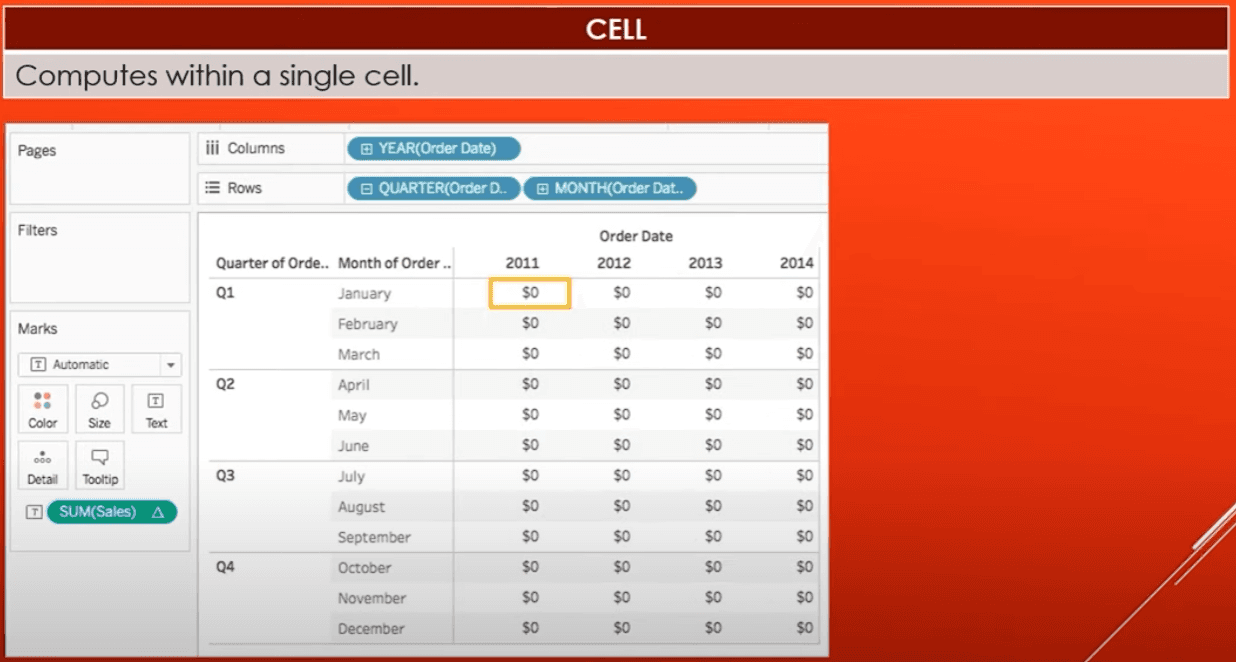
Cell.
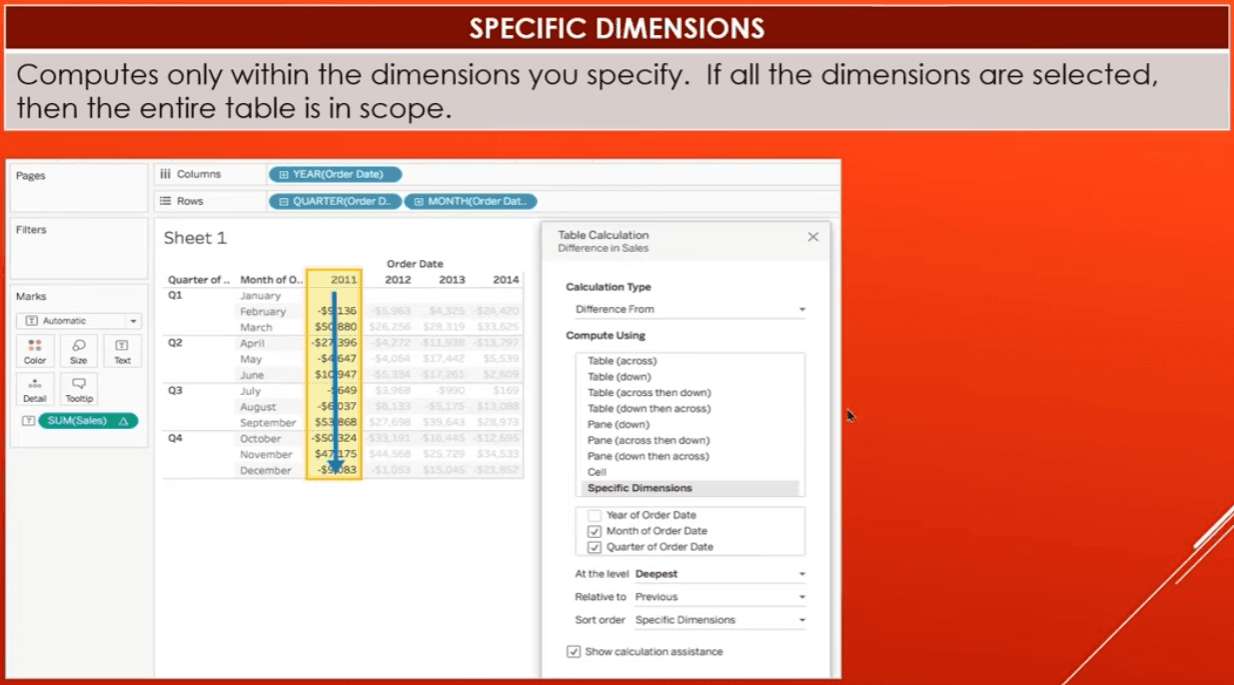
Specific dimensions.
Deepest - Calculation should be performed at the deepest level of granularity.
Quarter of Order Date - Calculation should be performed at the quarter level.
Month of Order Date - Calculation should be performed at the month level.
Difference
Create a new worksheet.
Drag Order Date to the Columns shelf, and State/Province to the Rows shelf.
Drag the Sales measure to the text box on the Marks card, and drag the Profit measure to the colour measure on the marks card.
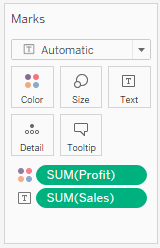
Now in the mark type dropdown (where it says Automatic on the marks card), choose square.
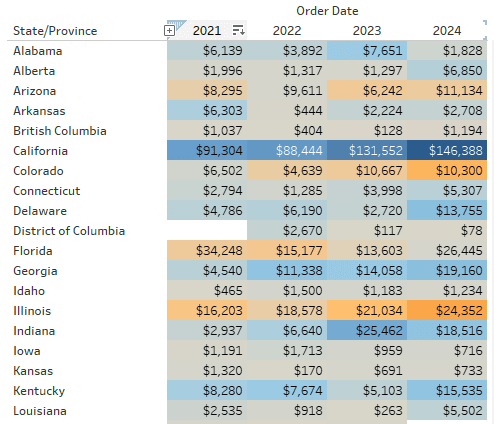
We're now ready to add our quick table calculation.
Right click on SUM(Profit) in the marks card, hover over Quick Table Calculation, and choose Difference.
When you hover over a square it'll show you the profit difference compared to the previous square. The very first column has this value empty as there is no column before it to compare it to.
You'll notice that SUM(Profit) has a delta symbol on it - this conveys it has a table calculation applied to it.
If we want to see the calculation window we can right click on SUM(Profit), and go to Edit Table Calculation.
Pane (across then down)
Create a new worksheet, and drag Order Date to Rows.
Click the plus sign in front of YEAR(Order Date); This will give QUARTER(Order Date). Click the plus sign in front of QUARTER(Order Date) and it will give MONTH(Order Date).
Drag & drop YEAR(Order Date) from the Rows shelf into the Columns shelf.
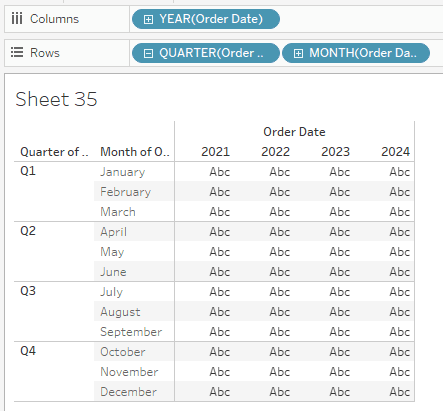
Drag the Sales measure into the Text box in the Marks card.
We're now ready for our table calculation. Right click SUM(Sales) in the Marks card, and go to Add Table Calculation.
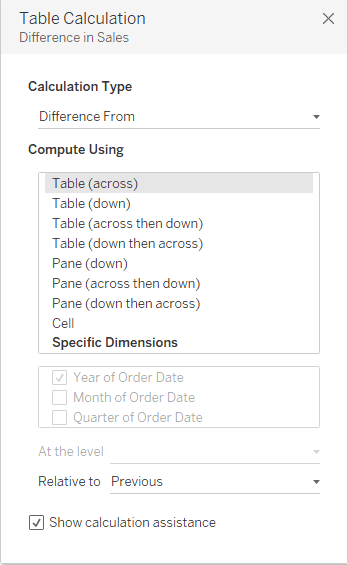
Select Pane (across then down), then exit the box.
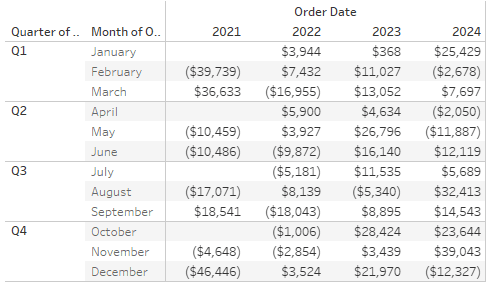
The numbers represent the difference in sales, not the sales values. i.e., for Q1 January 2022, $3,944 represents a $3,944 difference between 2021 and 2022 in sales. February 2021 compares to January 2024. Negative numbers show in parentheses.
Specific Dimensions
Create a new sheet.
Add YEAR(Order Date) and QUARTER(Order Date) to Columns, and Region and Category to Rows.
Drag the Sales measure to the Text box in the Marks card to populate the table.
Now, duplicate this sheet by right clicking on the sheet tab down the bottom and selecting Duplicate.
In this duplicate, right click on SUM(Sales) in the Marks card, and choose Add Table Calculation.
Change the calculation type to Running Total, then close the box.
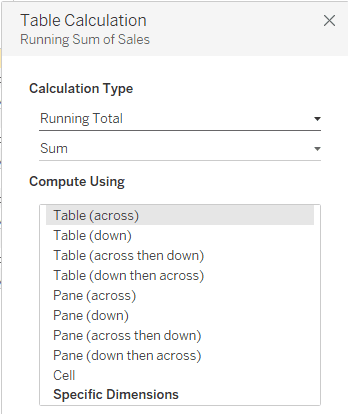
What we're seeing is the running (cumulative) sales based on our initial sheet we duplicated.

Now in our sheet with the running total, right click on SUM(Sales) in the Marks card and Edit Table Calculation.
Choose Specific Dimensions, and in 'Restarting every', choose Year of Order Date.
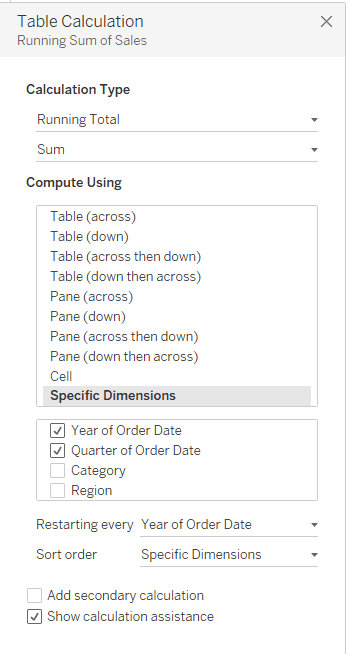
So we're telling it: calculate the running total for the year and quarter of Order Date and restart for every year.
Running Total: Table (down then across)
Create a new sheet.
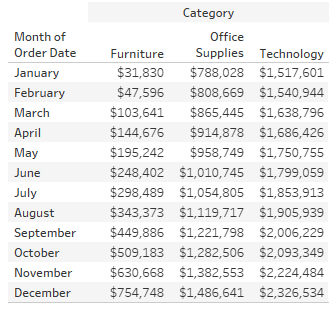
Put Category in Columns, MONTH(Order Date) in Rows, and Sales in the Text box of the Marks card.
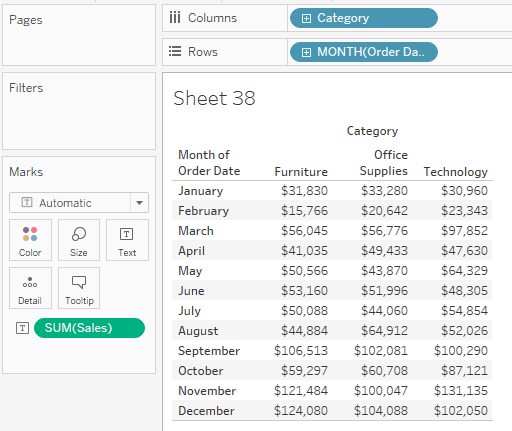
Right click on SUM(Sales) in the Marks card, choosing Add Table Calculation, select the Calculation Type to Running Total, then choose Table (down then across) for Compute Using. Exit the box.
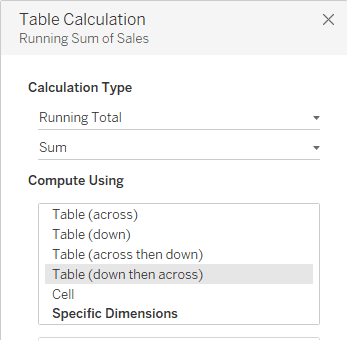
This shows the progression of all the sales, with December, Technology being the total sales amount.
Secondary calculation - Running Total: Table (down then across) & Percent Difference From: Table (across then down)
Create a new worksheet moving State/Province to Columns, and Segment to Rows.
Right click on State/Province in Columns, choose filter, then Click the None button.
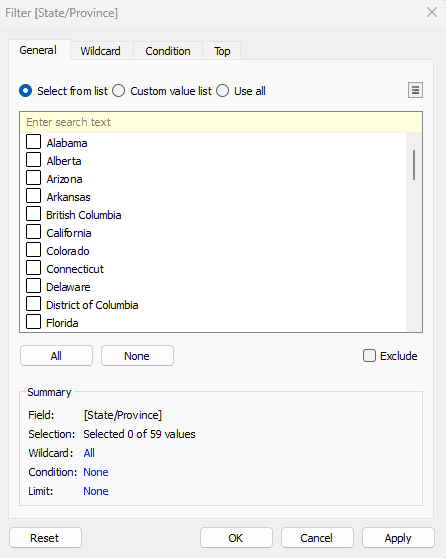
Then, select Arizona, California, Idaho, New Mexico, Oregon, and finally Washington. Click OK.
Drag Sales to the Text box in the Marks card.
Right click on SUM(Sales) in the Marks card, choosing Add Table Calculation.
Choose Running Total, Table (down then across), then select Add secondary calculation.
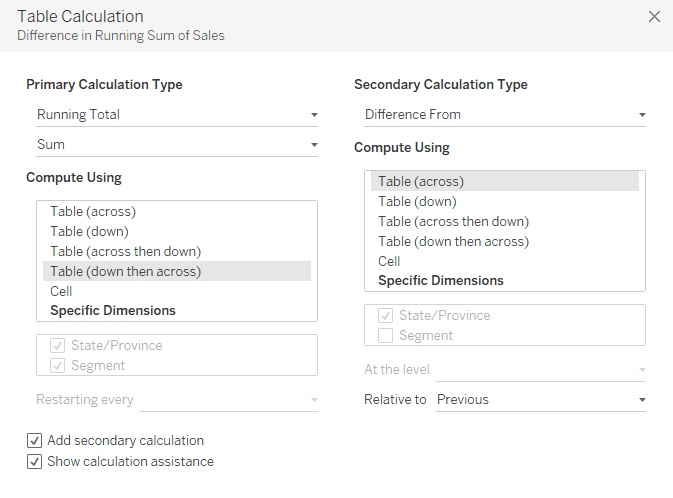
For the Secondary Calculation Type choose Percent Difference From, Table (across then down), then close the box.

The percentages we see are the percent difference in that running total sum of sales from the previous one.
The other thing we want to do is give the end users some flexibility - right click on State/Province in Columns and choose Show Filter. A state filter will pop up to the right.
Introduction
Table calculations allow you to transform values at the level of detail of the visualization only.
Quick table calculations allow you to quickly apply a common table calculation to your visualization using the most typical settings for that calculation type.

Make sure you are have open the Sample Superstore workbook in Tableau.

Direction
Table across computes across the length of the table and restarts after every partition. It will go across and perform the calculation then it will go down to the next row and perform the calculation.

Table down computes down the length of the table and restarts after every partition. It will use the computation for all of 2011, then it will start over again for all of 2012.

Table across then down will go all the way across January then it will go down and across February, and it will keep going across then down the length of the table.

Table down then across goes down 2011, then across to 2012 and down so on and so forth.

Pane down.

Pane across then down goes across the entire pane then down the entire pane before moving to the next pane.

Pane down then across.

Cell.

Specific dimensions.
Deepest - Calculation should be performed at the deepest level of granularity.
Quarter of Order Date - Calculation should be performed at the quarter level.
Month of Order Date - Calculation should be performed at the month level.

Difference
Create a new worksheet.
Drag Order Date to the Columns shelf, and State/Province to the Rows shelf.
Drag the Sales measure to the text box on the Marks card, and drag the Profit measure to the colour measure on the marks card.

Now in the mark type dropdown (where it says Automatic on the marks card), choose square.

We're now ready to add our quick table calculation.
Right click on SUM(Profit) in the marks card, hover over Quick Table Calculation, and choose Difference.
When you hover over a square it'll show you the profit difference compared to the previous square. The very first column has this value empty as there is no column before it to compare it to.
You'll notice that SUM(Profit) has a delta symbol on it - this conveys it has a table calculation applied to it.
If we want to see the calculation window we can right click on SUM(Profit), and go to Edit Table Calculation.
Pane (across then down)
Create a new worksheet, and drag Order Date to Rows.
Click the plus sign in front of YEAR(Order Date); This will give QUARTER(Order Date). Click the plus sign in front of QUARTER(Order Date) and it will give MONTH(Order Date).
Drag & drop YEAR(Order Date) from the Rows shelf into the Columns shelf.

Drag the Sales measure into the Text box in the Marks card.
We're now ready for our table calculation. Right click SUM(Sales) in the Marks card, and go to Add Table Calculation.

Select Pane (across then down), then exit the box.
The numbers represent the difference in sales, not the sales values. i.e., for Q1 January 2022, $3,944 represents a $3,944 difference between 2021 and 2022 in sales. February 2021 compares to January 2024. Negative numbers show in parentheses.

Specific Dimensions
Create a new sheet.
Add YEAR(Order Date) and QUARTER(Order Date) to Columns, and Region and Category to Rows.
Drag the Sales measure to the Text box in the Marks card to populate the table.
Now, duplicate this sheet by right clicking on the sheet tab down the bottom and selecting Duplicate.
In this duplicate, right click on SUM(Sales) in the Marks card, and choose Add Table Calculation.
Change the calculation type to Running Total, then close the box.

What we're seeing is the running (cumulative) sales based on our initial sheet we duplicated.

Now in our sheet with the running total, right click on SUM(Sales) in the Marks card and Edit Table Calculation.
Choose Specific Dimensions, and in 'Restarting every', choose Year of Order Date.

So we're telling it: calculate the running total for the year and quarter of Order Date and restart for every year.
Running Total: Table (down then across)
Create a new sheet.
Put Category in Columns, MONTH(Order Date) in Rows, and Sales in the Text box of the Marks card.

Right click on SUM(Sales) in the Marks card, choosing Add Table Calculation, select the Calculation Type to Running Total, then choose Table (down then across) for Compute Using. Exit the box.

This shows the progression of all the sales, with December, Technology being the total sales amount.

Secondary calculation - Running Total: Table (down then across) & Percent Difference From: Table (across then down)
Create a new worksheet moving State/Province to Columns, and Segment to Rows.
Right click on State/Province in Columns, choose filter, then Click the None button.

Then, select Arizona, California, Idaho, New Mexico, Oregon, and finally Washington. Click OK.
Drag Sales to the Text box in the Marks card.
Right click on SUM(Sales) in the Marks card, choosing Add Table Calculation.
Choose Running Total, Table (down then across), then select Add secondary calculation.

For the Secondary Calculation Type choose Percent Difference From, Table (across then down), then close the box.

The percentages we see are the percent difference in that running total sum of sales from the previous one.
The other thing we want to do is give the end users some flexibility - right click on State/Province in Columns and choose Show Filter. A state filter will pop up to the right.
Introduction
Table calculations allow you to transform values at the level of detail of the visualization only.
Quick table calculations allow you to quickly apply a common table calculation to your visualization using the most typical settings for that calculation type.

Make sure you are have open the Sample Superstore workbook in Tableau.

Direction
Table across computes across the length of the table and restarts after every partition. It will go across and perform the calculation then it will go down to the next row and perform the calculation.

Table down computes down the length of the table and restarts after every partition. It will use the computation for all of 2011, then it will start over again for all of 2012.

Table across then down will go all the way across January then it will go down and across February, and it will keep going across then down the length of the table.

Table down then across goes down 2011, then across to 2012 and down so on and so forth.

Pane down.

Pane across then down goes across the entire pane then down the entire pane before moving to the next pane.

Pane down then across.

Cell.

Specific dimensions.
Deepest - Calculation should be performed at the deepest level of granularity.
Quarter of Order Date - Calculation should be performed at the quarter level.
Month of Order Date - Calculation should be performed at the month level.

Difference
Create a new worksheet.
Drag Order Date to the Columns shelf, and State/Province to the Rows shelf.
Drag the Sales measure to the text box on the Marks card, and drag the Profit measure to the colour measure on the marks card.

Now in the mark type dropdown (where it says Automatic on the marks card), choose square.

We're now ready to add our quick table calculation.
Right click on SUM(Profit) in the marks card, hover over Quick Table Calculation, and choose Difference.
When you hover over a square it'll show you the profit difference compared to the previous square. The very first column has this value empty as there is no column before it to compare it to.
You'll notice that SUM(Profit) has a delta symbol on it - this conveys it has a table calculation applied to it.
If we want to see the calculation window we can right click on SUM(Profit), and go to Edit Table Calculation.
Pane (across then down)
Create a new worksheet, and drag Order Date to Rows.
Click the plus sign in front of YEAR(Order Date); This will give QUARTER(Order Date). Click the plus sign in front of QUARTER(Order Date) and it will give MONTH(Order Date).
Drag & drop YEAR(Order Date) from the Rows shelf into the Columns shelf.

Drag the Sales measure into the Text box in the Marks card.
We're now ready for our table calculation. Right click SUM(Sales) in the Marks card, and go to Add Table Calculation.

Select Pane (across then down), then exit the box.
The numbers represent the difference in sales, not the sales values. i.e., for Q1 January 2022, $3,944 represents a $3,944 difference between 2021 and 2022 in sales. February 2021 compares to January 2024. Negative numbers show in parentheses.

Specific Dimensions
Create a new sheet.
Add YEAR(Order Date) and QUARTER(Order Date) to Columns, and Region and Category to Rows.
Drag the Sales measure to the Text box in the Marks card to populate the table.
Now, duplicate this sheet by right clicking on the sheet tab down the bottom and selecting Duplicate.
In this duplicate, right click on SUM(Sales) in the Marks card, and choose Add Table Calculation.
Change the calculation type to Running Total, then close the box.

What we're seeing is the running (cumulative) sales based on our initial sheet we duplicated.

Now in our sheet with the running total, right click on SUM(Sales) in the Marks card and Edit Table Calculation.
Choose Specific Dimensions, and in 'Restarting every', choose Year of Order Date.

So we're telling it: calculate the running total for the year and quarter of Order Date and restart for every year.
Running Total: Table (down then across)
Create a new sheet.
Put Category in Columns, MONTH(Order Date) in Rows, and Sales in the Text box of the Marks card.

Right click on SUM(Sales) in the Marks card, choosing Add Table Calculation, select the Calculation Type to Running Total, then choose Table (down then across) for Compute Using. Exit the box.

This shows the progression of all the sales, with December, Technology being the total sales amount.

Secondary calculation - Running Total: Table (down then across) & Percent Difference From: Table (across then down)
Create a new worksheet moving State/Province to Columns, and Segment to Rows.
Right click on State/Province in Columns, choose filter, then Click the None button.

Then, select Arizona, California, Idaho, New Mexico, Oregon, and finally Washington. Click OK.
Drag Sales to the Text box in the Marks card.
Right click on SUM(Sales) in the Marks card, choosing Add Table Calculation.
Choose Running Total, Table (down then across), then select Add secondary calculation.

For the Secondary Calculation Type choose Percent Difference From, Table (across then down), then close the box.

The percentages we see are the percent difference in that running total sum of sales from the previous one.
The other thing we want to do is give the end users some flexibility - right click on State/Province in Columns and choose Show Filter. A state filter will pop up to the right.
CONTENT
SHARE