CONTENT
Notifications in your Power BI report
Implement a notification bell in Power BI to keep users updated with key messages and information directly within the report.


Saartje Ly
Data Engineering Intern
May 12, 2024
Notifications in Power BI report
Wouldn't it be great to have up-to-date notifications inside your report?
Today, learn how to implement a notification bell to add information and communicate key messages to share with your report readers.
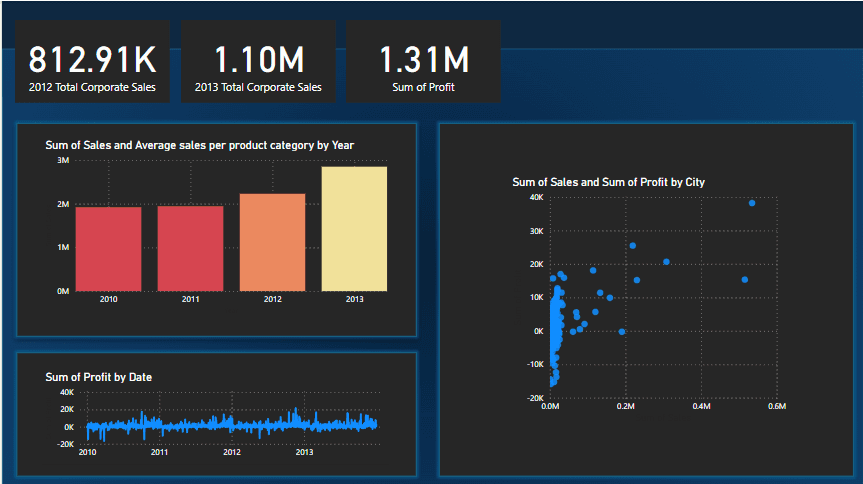
We’d like to start by adding a little bell icon at the top.
1. Open PowerPoint
2. In the Insert tab, click on the Icons button
3. Search for a bell and import the icon

4. Re-colour your icon as necessary
5. Right click your icon and select Save as Picture… to save.
If you’d like a different icon you can go to sites such as flaticon.com.
Head back to Power BI.
6. Head to the Insert tab, then click the image button to load your bell image in.
We now would like to add in the notification wall.
Let’s say you have an excel spreadsheet with notifications and their dates.
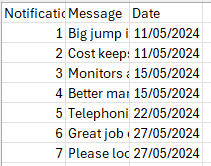
We can load this table directly into Power BI.
7. In the Home tab, click on Excel workbook and load in your notification data.
8. Once this is done, create a new page for the custom tool tip.
9. In the Visualizations pane switch to Format page, then under Page information turn on Allow use as tooltip.
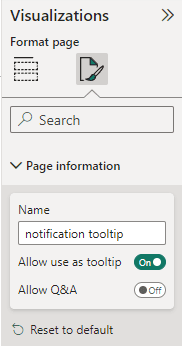
10. Update the Canvas settings directly below; Change Type to Custom, and adjust the height and width if necessary.
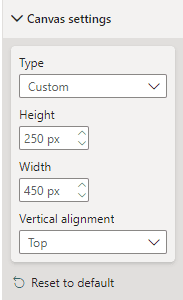
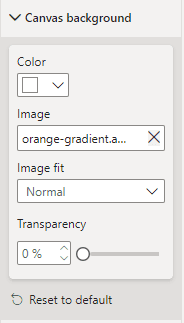
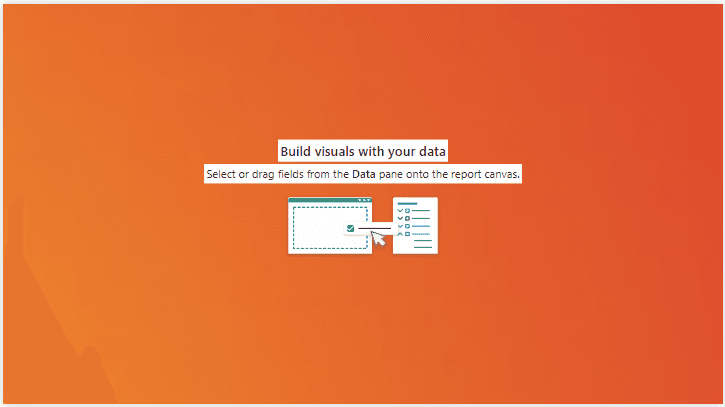
11. Still in the Visualizations pane, in Canvas background add in an image for the background. Change transparency to 0 to be able to see this background, and change Image fit to Fit.
12. Add in a table visual
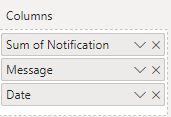
13. Add in your Notification numbers, Message, and Date fields into the Columns box in the Visualizations pane
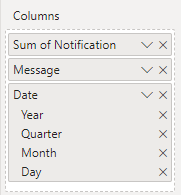
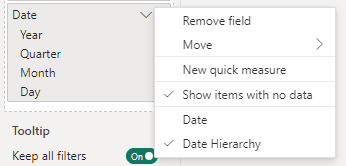
14. Click the down arrow on Date, and change from Date Hierarchy to Date.
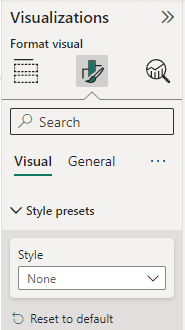
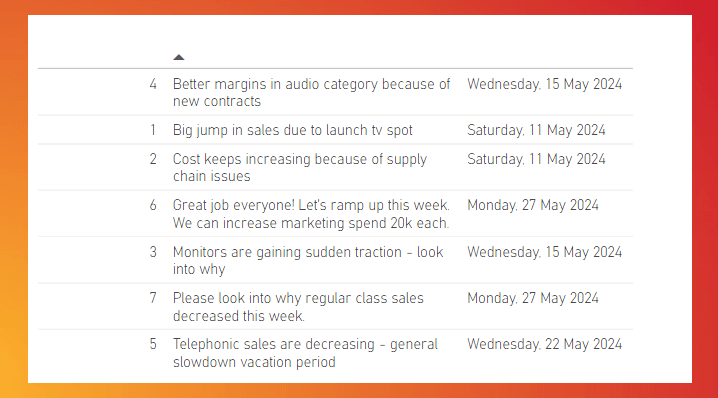
15. In Format visual under Style presents, change Style to None.
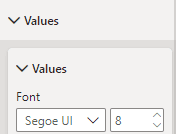
16. In Format visual under Values, change the Font to as small as possible. Change Font type if preferred.
17. Scroll down to Totals and turn Values off
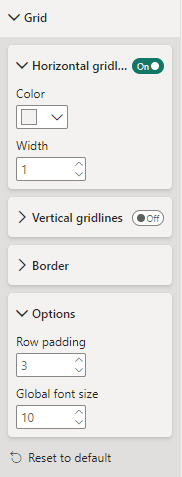
18. In Grid, inside Options, change the row padding to 3.
19. Make the message column smaller so the text wraps onto the next line. Click and pull inwards from the right side of the Message title box.
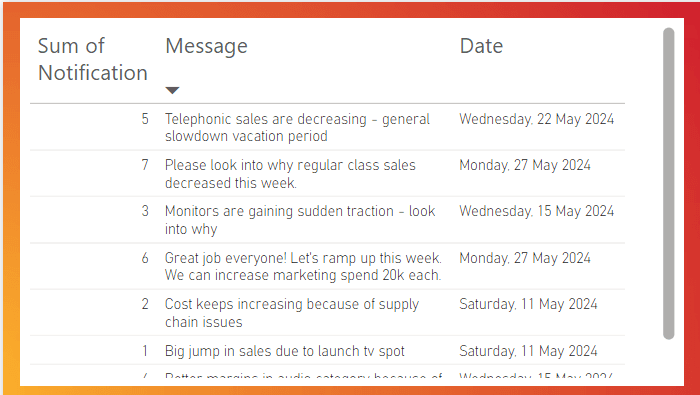
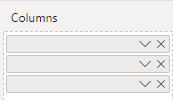
20. Remove the header names by replacing the Column names with a space. Double click to edit, and hit enter to save.
21. In Format visual, General, Effects, turn the background off.

22. Navigate to the Insert tab, click Shapes, and insert the desired background shape. Update the colour and style as necessary, then make the shape slightly larger than the table.
23. Send this shape to the back by heading to the Format tab, and clicking Send backward.
24. Select the table again. In Format visual, open Grid, Border, change Section to Column header, and untick Bottom.

25. Add the bell to the top left hand side if desired
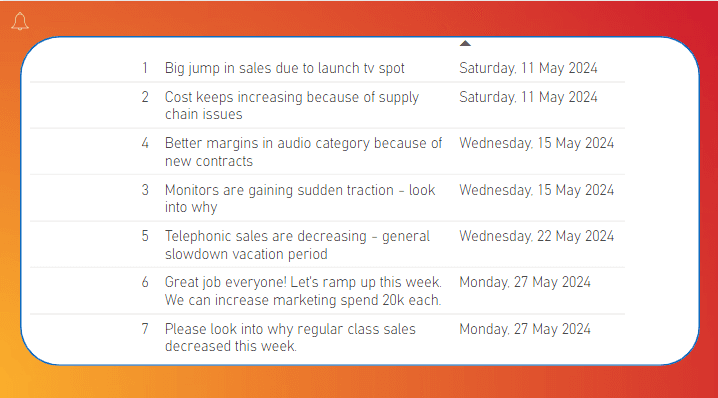
Let’s now go back to the report page and add it as a tooltip to the bell icon.
26. Back in the report page, place a card visual on top of the bell icon. Populate with random data.
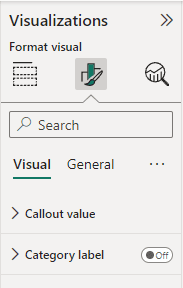
27. In Format visual, turn Category label off
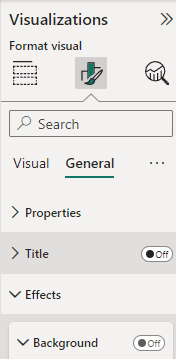
28. Turn Background off under Effects
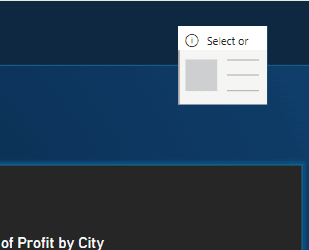
This should essentially make the card invisible. If you can still see text, make the card smaller or enlarge the text until the text is out of view.
29. Head to General, Tooltips under format visual and turn it on. Change type to Report page, and page to your notification tooltip page.

When you hover over your bell, you should now see your messages tooltip.
We’d now like to limit the number of messages you can see in your tooltip, as only the most recent will be relevant. Go back to your navigation tooltip page.
30. Select your notification table, then drag and drop your notification field to the filter box that says Add data fields here.
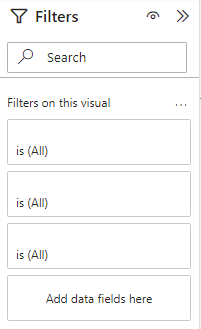
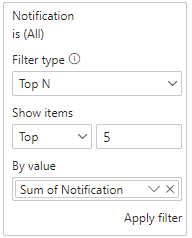
31. Change the filter type to Top N, fill in the show top number, and finally drag and drop your notification field into the By value box. Click Apply filter when done. Below we are saying we want to see the top 5 messages.
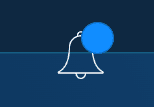
We now want to add a circle to the bell that tells us the number of new messages.
32. Head to the Insert tab, click Shapes, and insert an oval.
33. Resize and add to the top of your bell
We’d now like to create a measure that counts the number of new messages
34. Right click your Notifications table in the Data pane, and select New measure
35. Add this DAX below. Here we are saying we want to calculate the count of messages where the date is 3 days behind today, with &”” added to convert it into text.
ie, count messages from up to 3 days ago
36. Click your circle again, head to format shape, Style, Text and turn Text on. Then click the fx button next to text (conditional formatting button).
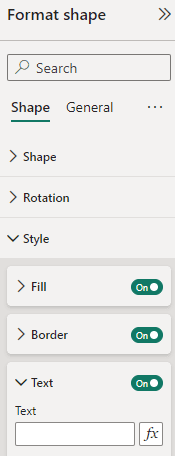
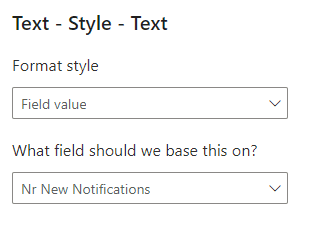
37. Make sure to base the Field value on your number of new notifications calculated measure. Click OK when done.
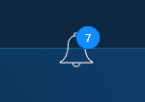
We’d now like to highlight these new messages.
38. Create another new measure for your notifications table in the Data pane
39. Add this DAX below. Here we are saying if the date is sooner than three days ago, change the colour.
40. Go back to your notification tooltip page and click on your table
41. Head to format visual, find Cell elements, and turn on Background color. Finally, click the fx button again.
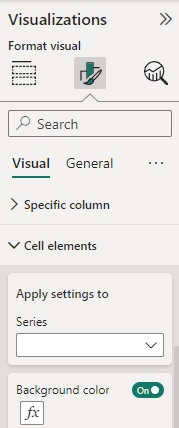
42. Change Format style to Field value, base it on your Notifications Highlight measure, and Apply to Values only. Click OK when done.
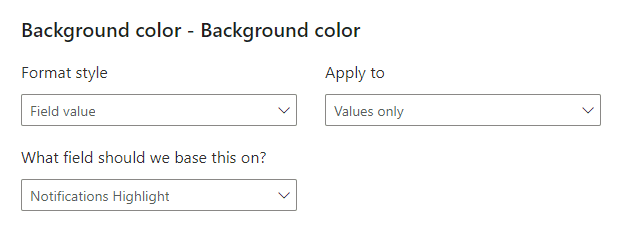
You’ll notice there are other Background color options in Cell elements. Turn them on and apply the same process as step 42.
There you have it. All new messages should now be coloured in gray when you hover over your bell icon.
Notifications in Power BI report
Wouldn't it be great to have up-to-date notifications inside your report?
Today, learn how to implement a notification bell to add information and communicate key messages to share with your report readers.

We’d like to start by adding a little bell icon at the top.
1. Open PowerPoint
2. In the Insert tab, click on the Icons button
3. Search for a bell and import the icon

4. Re-colour your icon as necessary
5. Right click your icon and select Save as Picture… to save.
If you’d like a different icon you can go to sites such as flaticon.com.
Head back to Power BI.
6. Head to the Insert tab, then click the image button to load your bell image in.
We now would like to add in the notification wall.
Let’s say you have an excel spreadsheet with notifications and their dates.

We can load this table directly into Power BI.
7. In the Home tab, click on Excel workbook and load in your notification data.
8. Once this is done, create a new page for the custom tool tip.
9. In the Visualizations pane switch to Format page, then under Page information turn on Allow use as tooltip.

10. Update the Canvas settings directly below; Change Type to Custom, and adjust the height and width if necessary.

11. Still in the Visualizations pane, in Canvas background add in an image for the background. Change transparency to 0 to be able to see this background, and change Image fit to Fit.


12. Add in a table visual
13. Add in your Notification numbers, Message, and Date fields into the Columns box in the Visualizations pane

14. Click the down arrow on Date, and change from Date Hierarchy to Date.

15. In Format visual under Style presents, change Style to None.

16. In Format visual under Values, change the Font to as small as possible. Change Font type if preferred.

17. Scroll down to Totals and turn Values off
18. In Grid, inside Options, change the row padding to 3.

19. Make the message column smaller so the text wraps onto the next line. Click and pull inwards from the right side of the Message title box.

20. Remove the header names by replacing the Column names with a space. Double click to edit, and hit enter to save.


21. In Format visual, General, Effects, turn the background off.

22. Navigate to the Insert tab, click Shapes, and insert the desired background shape. Update the colour and style as necessary, then make the shape slightly larger than the table.
23. Send this shape to the back by heading to the Format tab, and clicking Send backward.
24. Select the table again. In Format visual, open Grid, Border, change Section to Column header, and untick Bottom.

25. Add the bell to the top left hand side if desired

Let’s now go back to the report page and add it as a tooltip to the bell icon.
26. Back in the report page, place a card visual on top of the bell icon. Populate with random data.

27. In Format visual, turn Category label off

28. Turn Background off under Effects

This should essentially make the card invisible. If you can still see text, make the card smaller or enlarge the text until the text is out of view.
29. Head to General, Tooltips under format visual and turn it on. Change type to Report page, and page to your notification tooltip page.

When you hover over your bell, you should now see your messages tooltip.
We’d now like to limit the number of messages you can see in your tooltip, as only the most recent will be relevant. Go back to your navigation tooltip page.
30. Select your notification table, then drag and drop your notification field to the filter box that says Add data fields here.

31. Change the filter type to Top N, fill in the show top number, and finally drag and drop your notification field into the By value box. Click Apply filter when done. Below we are saying we want to see the top 5 messages.

We now want to add a circle to the bell that tells us the number of new messages.
32. Head to the Insert tab, click Shapes, and insert an oval.
33. Resize and add to the top of your bell

We’d now like to create a measure that counts the number of new messages
34. Right click your Notifications table in the Data pane, and select New measure
35. Add this DAX below. Here we are saying we want to calculate the count of messages where the date is 3 days behind today, with &”” added to convert it into text.
ie, count messages from up to 3 days ago
36. Click your circle again, head to format shape, Style, Text and turn Text on. Then click the fx button next to text (conditional formatting button).

37. Make sure to base the Field value on your number of new notifications calculated measure. Click OK when done.


We’d now like to highlight these new messages.
38. Create another new measure for your notifications table in the Data pane
39. Add this DAX below. Here we are saying if the date is sooner than three days ago, change the colour.
40. Go back to your notification tooltip page and click on your table
41. Head to format visual, find Cell elements, and turn on Background color. Finally, click the fx button again.

42. Change Format style to Field value, base it on your Notifications Highlight measure, and Apply to Values only. Click OK when done.

You’ll notice there are other Background color options in Cell elements. Turn them on and apply the same process as step 42.
There you have it. All new messages should now be coloured in gray when you hover over your bell icon.
Notifications in Power BI report
Wouldn't it be great to have up-to-date notifications inside your report?
Today, learn how to implement a notification bell to add information and communicate key messages to share with your report readers.

We’d like to start by adding a little bell icon at the top.
1. Open PowerPoint
2. In the Insert tab, click on the Icons button
3. Search for a bell and import the icon

4. Re-colour your icon as necessary
5. Right click your icon and select Save as Picture… to save.
If you’d like a different icon you can go to sites such as flaticon.com.
Head back to Power BI.
6. Head to the Insert tab, then click the image button to load your bell image in.
We now would like to add in the notification wall.
Let’s say you have an excel spreadsheet with notifications and their dates.

We can load this table directly into Power BI.
7. In the Home tab, click on Excel workbook and load in your notification data.
8. Once this is done, create a new page for the custom tool tip.
9. In the Visualizations pane switch to Format page, then under Page information turn on Allow use as tooltip.

10. Update the Canvas settings directly below; Change Type to Custom, and adjust the height and width if necessary.

11. Still in the Visualizations pane, in Canvas background add in an image for the background. Change transparency to 0 to be able to see this background, and change Image fit to Fit.


12. Add in a table visual
13. Add in your Notification numbers, Message, and Date fields into the Columns box in the Visualizations pane

14. Click the down arrow on Date, and change from Date Hierarchy to Date.

15. In Format visual under Style presents, change Style to None.

16. In Format visual under Values, change the Font to as small as possible. Change Font type if preferred.

17. Scroll down to Totals and turn Values off
18. In Grid, inside Options, change the row padding to 3.

19. Make the message column smaller so the text wraps onto the next line. Click and pull inwards from the right side of the Message title box.

20. Remove the header names by replacing the Column names with a space. Double click to edit, and hit enter to save.


21. In Format visual, General, Effects, turn the background off.

22. Navigate to the Insert tab, click Shapes, and insert the desired background shape. Update the colour and style as necessary, then make the shape slightly larger than the table.
23. Send this shape to the back by heading to the Format tab, and clicking Send backward.
24. Select the table again. In Format visual, open Grid, Border, change Section to Column header, and untick Bottom.

25. Add the bell to the top left hand side if desired

Let’s now go back to the report page and add it as a tooltip to the bell icon.
26. Back in the report page, place a card visual on top of the bell icon. Populate with random data.

27. In Format visual, turn Category label off

28. Turn Background off under Effects

This should essentially make the card invisible. If you can still see text, make the card smaller or enlarge the text until the text is out of view.
29. Head to General, Tooltips under format visual and turn it on. Change type to Report page, and page to your notification tooltip page.

When you hover over your bell, you should now see your messages tooltip.
We’d now like to limit the number of messages you can see in your tooltip, as only the most recent will be relevant. Go back to your navigation tooltip page.
30. Select your notification table, then drag and drop your notification field to the filter box that says Add data fields here.

31. Change the filter type to Top N, fill in the show top number, and finally drag and drop your notification field into the By value box. Click Apply filter when done. Below we are saying we want to see the top 5 messages.

We now want to add a circle to the bell that tells us the number of new messages.
32. Head to the Insert tab, click Shapes, and insert an oval.
33. Resize and add to the top of your bell

We’d now like to create a measure that counts the number of new messages
34. Right click your Notifications table in the Data pane, and select New measure
35. Add this DAX below. Here we are saying we want to calculate the count of messages where the date is 3 days behind today, with &”” added to convert it into text.
ie, count messages from up to 3 days ago
36. Click your circle again, head to format shape, Style, Text and turn Text on. Then click the fx button next to text (conditional formatting button).

37. Make sure to base the Field value on your number of new notifications calculated measure. Click OK when done.


We’d now like to highlight these new messages.
38. Create another new measure for your notifications table in the Data pane
39. Add this DAX below. Here we are saying if the date is sooner than three days ago, change the colour.
40. Go back to your notification tooltip page and click on your table
41. Head to format visual, find Cell elements, and turn on Background color. Finally, click the fx button again.

42. Change Format style to Field value, base it on your Notifications Highlight measure, and Apply to Values only. Click OK when done.

You’ll notice there are other Background color options in Cell elements. Turn them on and apply the same process as step 42.
There you have it. All new messages should now be coloured in gray when you hover over your bell icon.
CONTENT
SHARE