CONTENT
Create a vertical bar chart in Tableau
Get started with Tableau by importing Titanic data from Kaggle, visualizing age distributions, and adding labels for better insights.

Saartje Ly
Data Engineering Intern
July 17, 2024
Creating a vertical bar chart
Firstly, you'll want to download the train.csv data from Kaggle
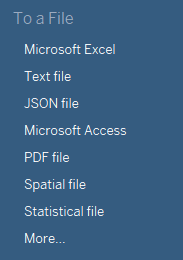
Click on Text File in the Tableau home page, and open that csv.
Once you import the data set, it'll show you all the data fields that exist.

You can access the data dictionary in Kaggle under the Data tab.
Go ahead and click on Sheet 1 down the bottom.
We want to turn our Age Measure into a dimension. If we leave Age as a measure, Tableau will simply add up all the ages in the visualization. However, we want to be able to visualize against different age brackets.
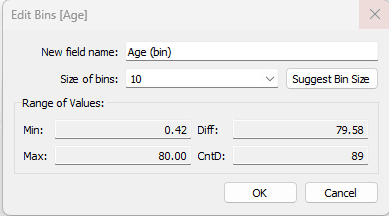
To turn Age into a dimension we want to put it in different bins. Click on the down arrow inside the Age pill, go to Create, and click Bins.
Size of bins is the number of years between each bucket.
Drag Age (bin) to Columns and Fare to Rows and you'll see the sum of fares for each age bucket. Note that if a different visualization pops up, click on Show Me up the top right hand corner and you'll see what visualizations are supported by the field types.
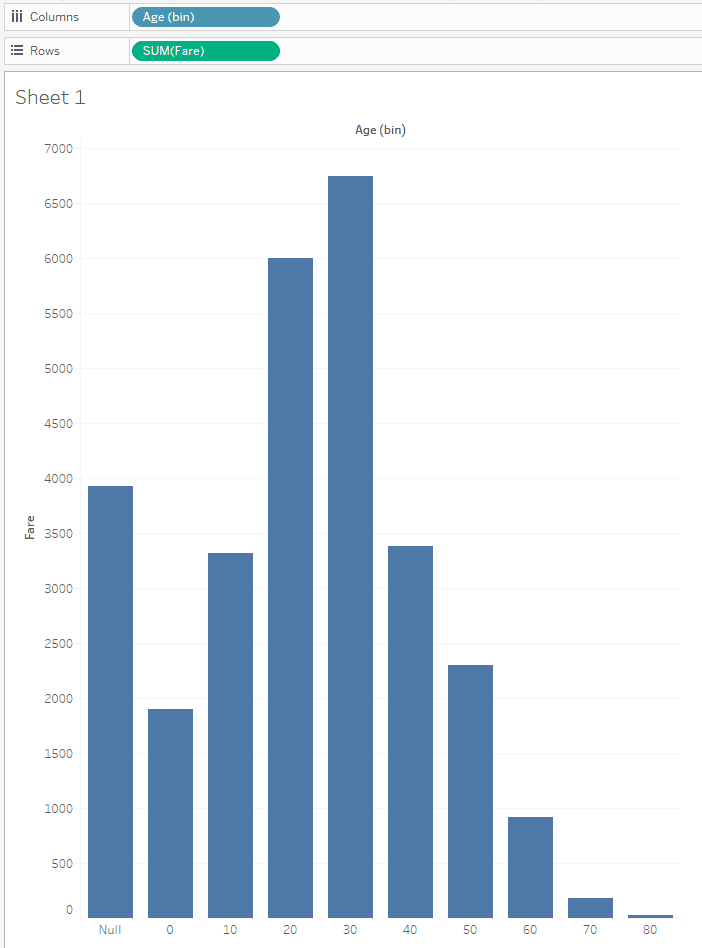
Let's filter out the null value. Hold ctrl + click on Age (bin) in the Columns shelf, and drag it over to the Filters bar.
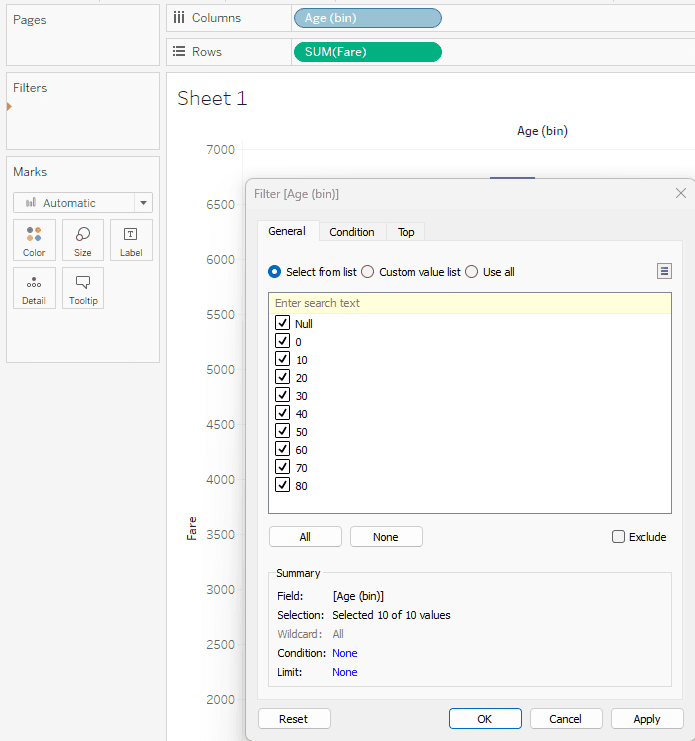
Untick Null and press OK. This gives the distribution without the null values.
This is great, but now we want to add some context with percentages.
Take the Fare measure again and pull it up to the Rows bar, click the down arrow on the pill, choose Quick Table Calculation, then Percent of Total. So now we have the volumes above and the percent of total below.
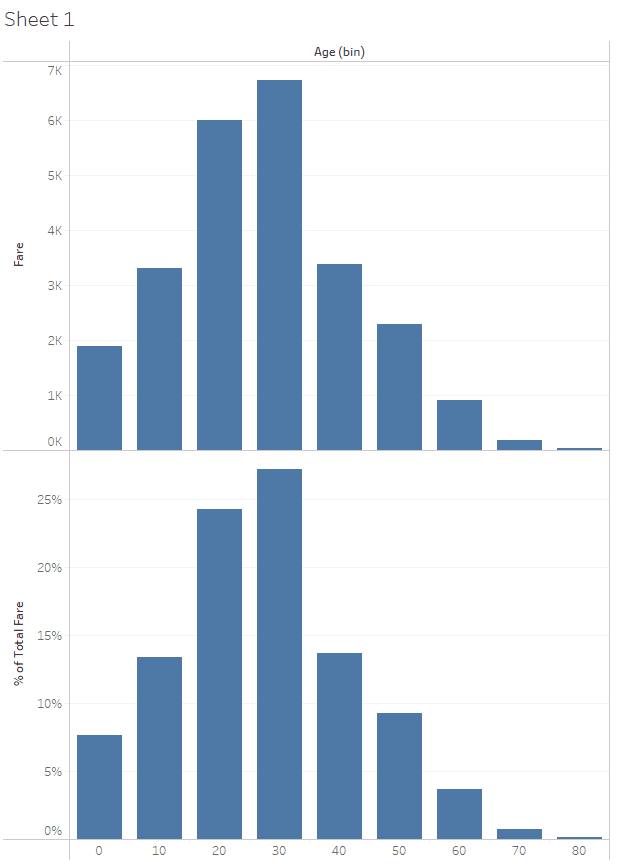
Let's add labels!
In the Marks card to the left, you'll notice SUM(FARE) twice. The first one represents the volumes and the second one represents the percentages.
Open the first one, ctrl + click the SUM(FARE) pill in Rows, and drag it onto the Labels box.
Open the second one, ctrl + click the SUM(FARE) pill with the triangle next to it, and drag it onto the Labels box.
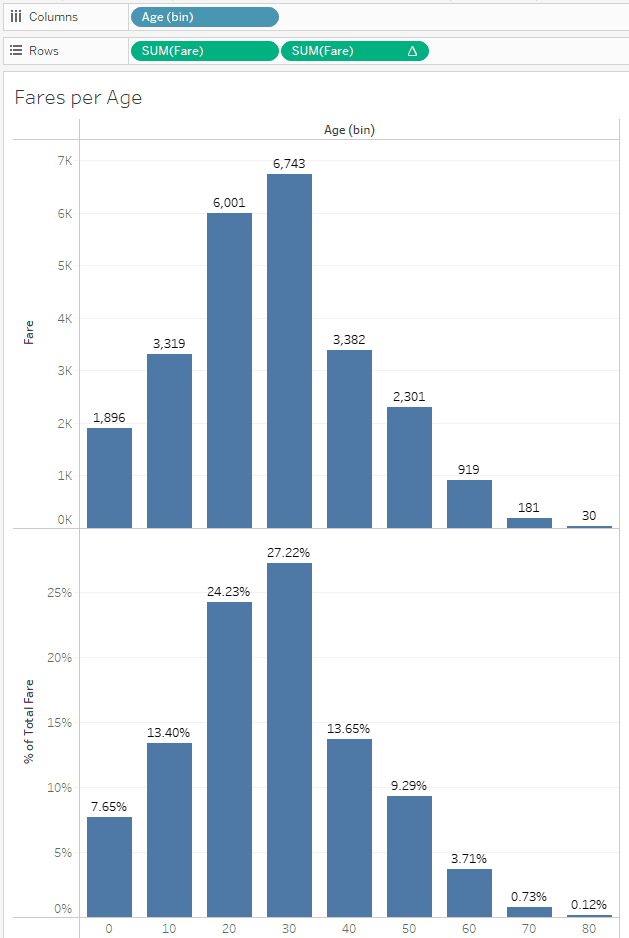
And so we can see what ages paid what percentage of the fares.
In the Marks card under All (to change both charts) click on the Color box to change the colour.
Creating a vertical bar chart
Firstly, you'll want to download the train.csv data from Kaggle
Click on Text File in the Tableau home page, and open that csv.

Once you import the data set, it'll show you all the data fields that exist.

You can access the data dictionary in Kaggle under the Data tab.
Go ahead and click on Sheet 1 down the bottom.
We want to turn our Age Measure into a dimension. If we leave Age as a measure, Tableau will simply add up all the ages in the visualization. However, we want to be able to visualize against different age brackets.
To turn Age into a dimension we want to put it in different bins. Click on the down arrow inside the Age pill, go to Create, and click Bins.
Size of bins is the number of years between each bucket.

Drag Age (bin) to Columns and Fare to Rows and you'll see the sum of fares for each age bucket. Note that if a different visualization pops up, click on Show Me up the top right hand corner and you'll see what visualizations are supported by the field types.

Let's filter out the null value. Hold ctrl + click on Age (bin) in the Columns shelf, and drag it over to the Filters bar.

Untick Null and press OK. This gives the distribution without the null values.
This is great, but now we want to add some context with percentages.
Take the Fare measure again and pull it up to the Rows bar, click the down arrow on the pill, choose Quick Table Calculation, then Percent of Total. So now we have the volumes above and the percent of total below.

Let's add labels!
In the Marks card to the left, you'll notice SUM(FARE) twice. The first one represents the volumes and the second one represents the percentages.
Open the first one, ctrl + click the SUM(FARE) pill in Rows, and drag it onto the Labels box.
Open the second one, ctrl + click the SUM(FARE) pill with the triangle next to it, and drag it onto the Labels box.

And so we can see what ages paid what percentage of the fares.
In the Marks card under All (to change both charts) click on the Color box to change the colour.
Creating a vertical bar chart
Firstly, you'll want to download the train.csv data from Kaggle
Click on Text File in the Tableau home page, and open that csv.

Once you import the data set, it'll show you all the data fields that exist.

You can access the data dictionary in Kaggle under the Data tab.
Go ahead and click on Sheet 1 down the bottom.
We want to turn our Age Measure into a dimension. If we leave Age as a measure, Tableau will simply add up all the ages in the visualization. However, we want to be able to visualize against different age brackets.
To turn Age into a dimension we want to put it in different bins. Click on the down arrow inside the Age pill, go to Create, and click Bins.
Size of bins is the number of years between each bucket.

Drag Age (bin) to Columns and Fare to Rows and you'll see the sum of fares for each age bucket. Note that if a different visualization pops up, click on Show Me up the top right hand corner and you'll see what visualizations are supported by the field types.

Let's filter out the null value. Hold ctrl + click on Age (bin) in the Columns shelf, and drag it over to the Filters bar.

Untick Null and press OK. This gives the distribution without the null values.
This is great, but now we want to add some context with percentages.
Take the Fare measure again and pull it up to the Rows bar, click the down arrow on the pill, choose Quick Table Calculation, then Percent of Total. So now we have the volumes above and the percent of total below.

Let's add labels!
In the Marks card to the left, you'll notice SUM(FARE) twice. The first one represents the volumes and the second one represents the percentages.
Open the first one, ctrl + click the SUM(FARE) pill in Rows, and drag it onto the Labels box.
Open the second one, ctrl + click the SUM(FARE) pill with the triangle next to it, and drag it onto the Labels box.

And so we can see what ages paid what percentage of the fares.
In the Marks card under All (to change both charts) click on the Color box to change the colour.
CONTENT
SHARE