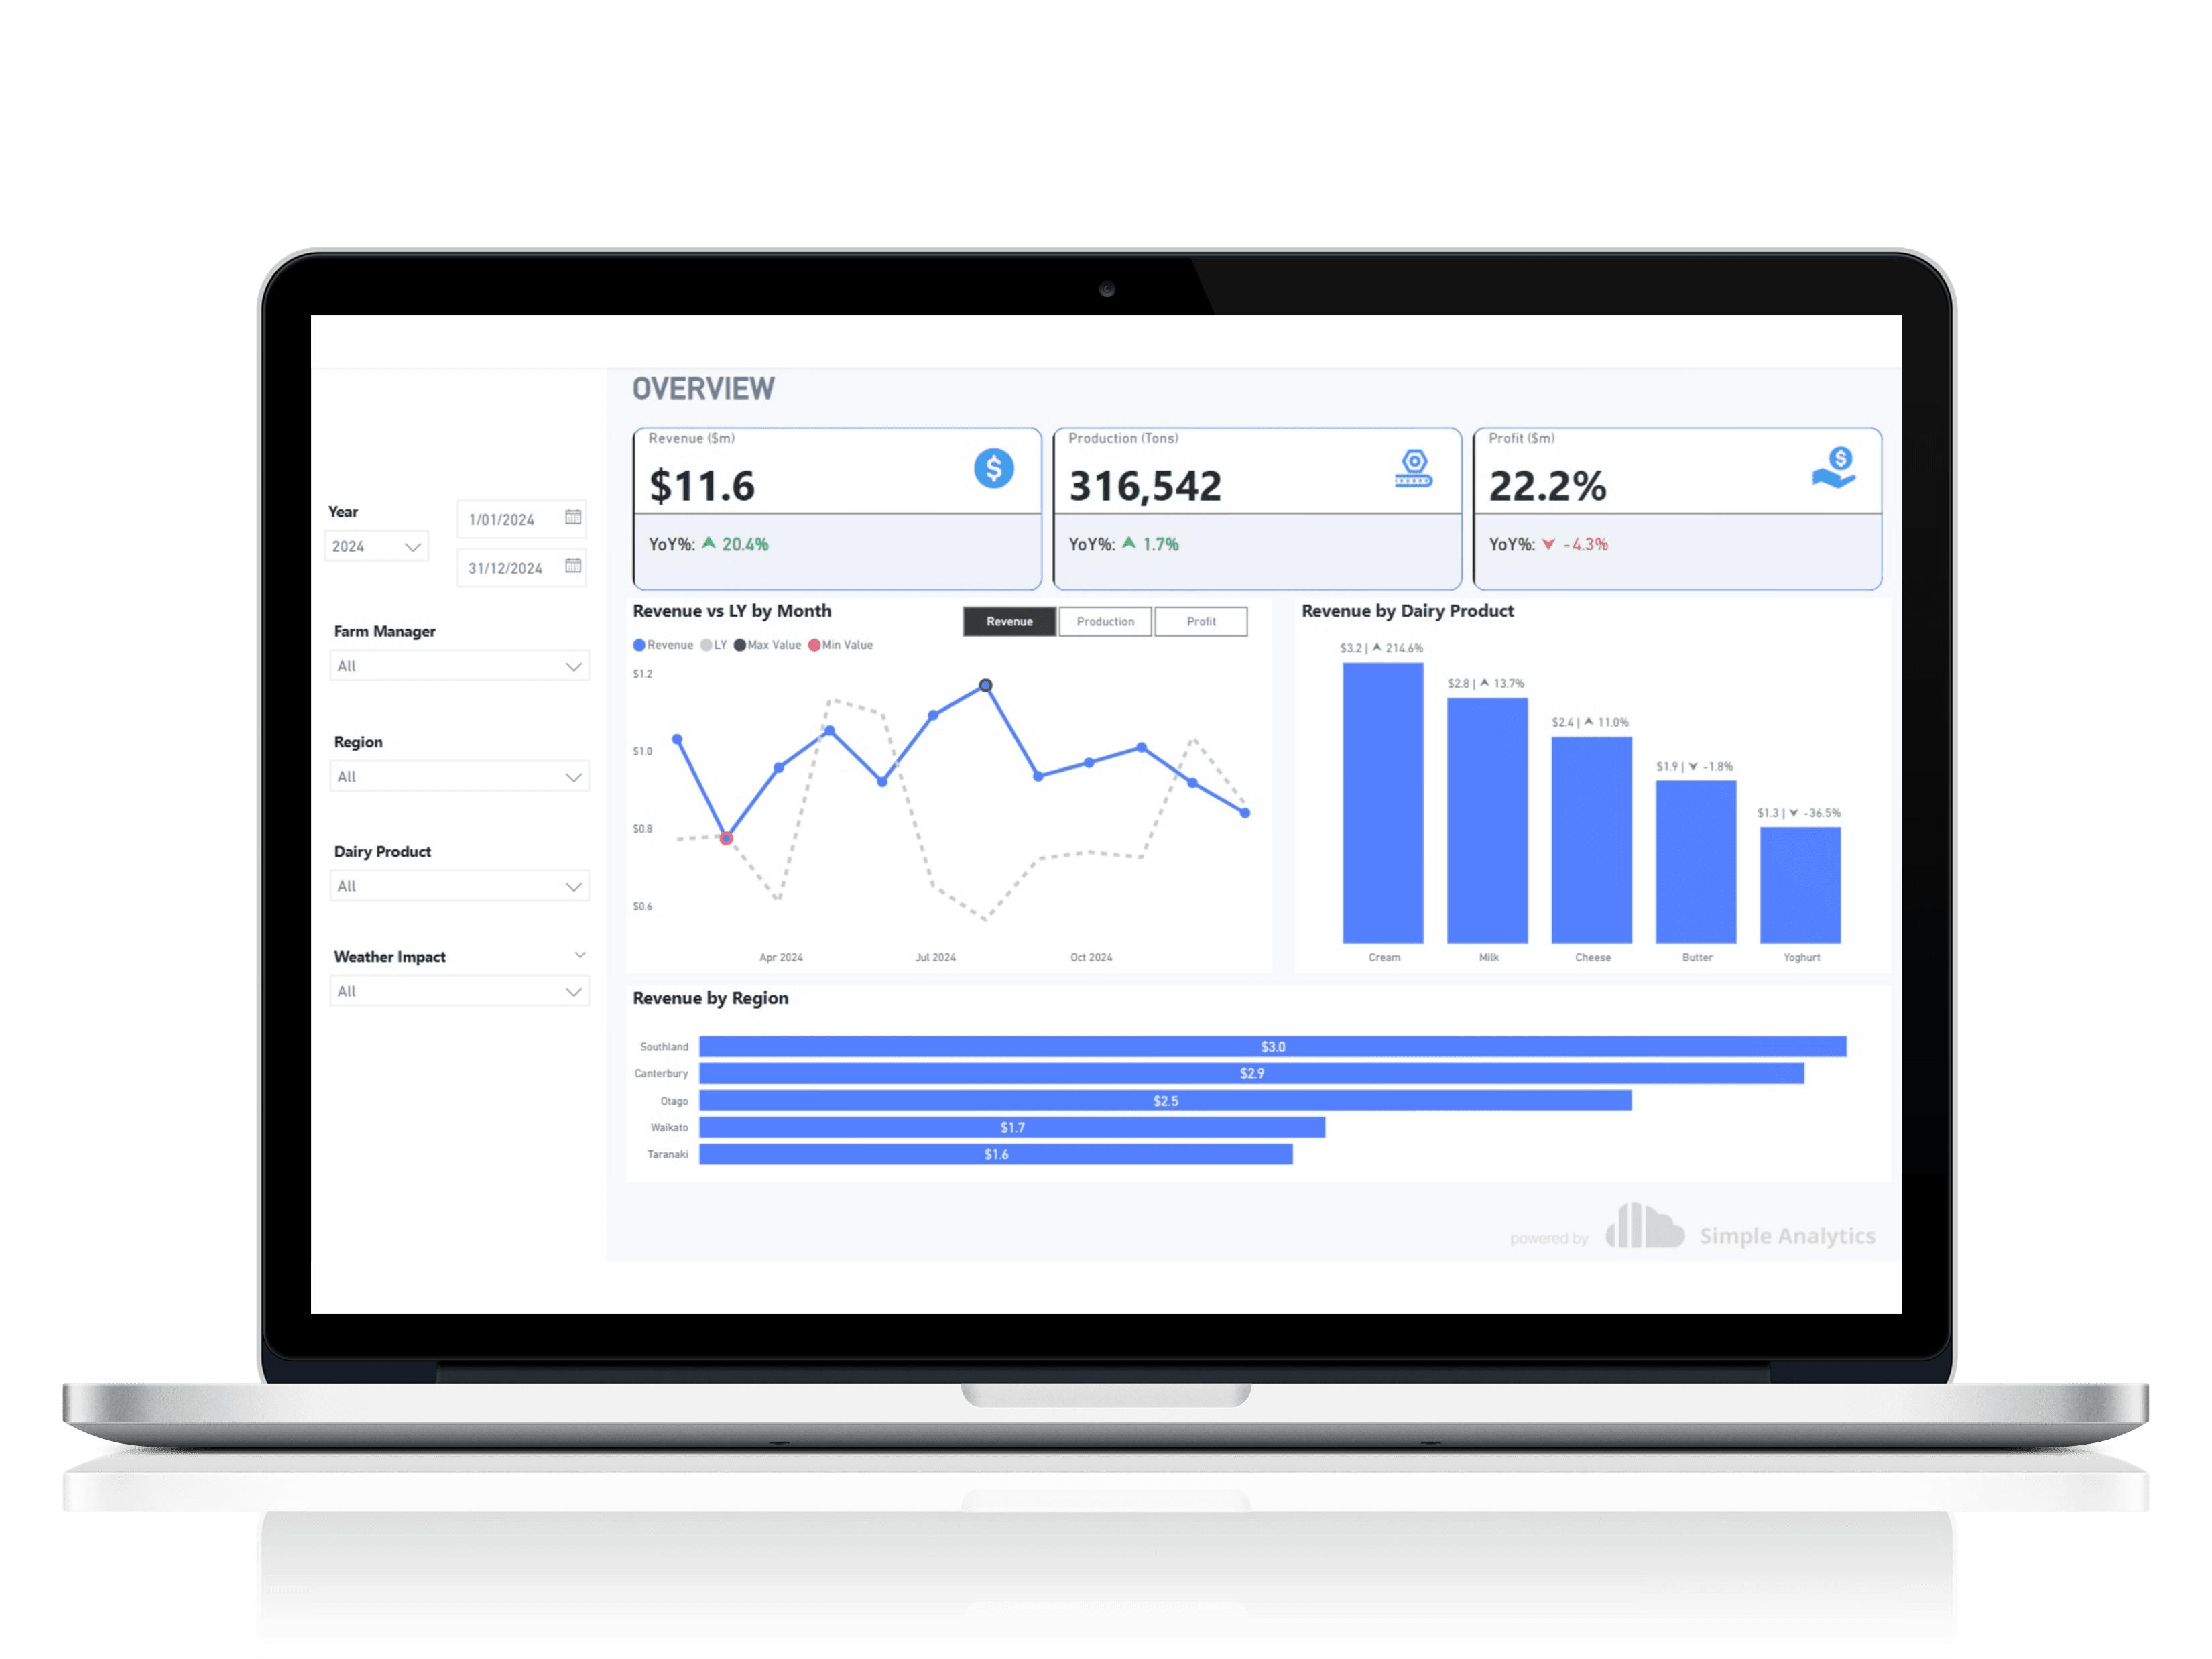
Simplify Your

Start using your business data and discover the possibilities of Data-Driven operations for effortless decision-making.

TRUSTED BY

TRUSTED BY

TRUSTED BY

Data Engineering from All Popular SaaS

Explore the Range of Supported Data Platforms for End-to-End Visibility.

Our Expertise

We specialise in a range of tools and coding languages to deliver a variety of data requirements.

Data Security Standards

We put security of your data at the forefront of design and implementation.

Integrated Systems

Integrate data platforms and enable viewability on multiple devices.

What our Customers have to say

Contact us to see how we can help you on your data journey too!

Jakob Young

The team were really helpful and friendly. Definitely recommend.

Jakob Young

The team were really helpful and friendly. Definitely recommend.

Shane Hutchinson

Great team to work with and even better results.

Shane Hutchinson

Great team to work with and even better results.

Natasha de Kock

Max and the team have transformed our conversations with business partners. The insights have allowed us to better understand our business - what is working vs what is not. Looking forward to working together again!

Natasha de Kock

Max and the team have transformed our conversations with business partners. The insights have allowed us to better understand our business - what is working vs what is not. Looking forward to working together again!

Mustafa Abdulla

Great Company, really know what they doing great dashboard building. Highly Recommended!

Mustafa Abdulla

Great Company, really know what they doing great dashboard building. Highly Recommended!

Ajay Shankar

Have been working with Jackie for a few months and his work/insights has made a significant difference to our business. We’ve been able to identify gaps and trends with meaningful reporting available which has been pretty remarkable – but I’d always like to see more! Thank you Jackie for all the help!

Jacques de Kock

Due to the size of our company, we are unable to maintain a full-time data analyst. However, as data is crucial to business, Simple Analytics' on-demand service is ideal for our needs.

Jacques de Kock

Due to the size of our company, we are unable to maintain a full-time data analyst. However, as data is crucial to business, Simple Analytics' on-demand service is ideal for our needs.

Nathan Lambert

Highly recommend working with this company. Easy to work with and very helpful

Nathan Lambert

Highly recommend working with this company. Easy to work with and very helpful

Alvin Cheung

Great company! Really know their stuff

Alvin Cheung

Great company! Really know their stuff

Carl Gordon

The team showed me the seasonality of my business using my invoice data. Now with this visibility, I have started to run campaigns pre-emptively to keep work flowing. I now at times need the odd subby in what used to be these quieter periods.

Carl Gordon

The team showed me the seasonality of my business using my invoice data. Now with this visibility, I have started to run campaigns pre-emptively to keep work flowing. I now at times need the odd subby in what used to be these quieter periods.

Frequently Asked Questions

Answers to some frequently asked questions

What is a BI dashboard?

A BI dashboard is a visual tool that presents business data and analysis in an easily consumable format. It provides a real-time snapshot of the organization's performance, making it easier to make data-driven decisions.

What are the benefits of a BI dashboard?

BI dashboards can help organizations improve their decision-making processes, increase efficiency, identify trends, and optimize performance. It also helps to monitor key performance indicators (KPIs) and track progress towards organizational goals.

What kind of data can be used in a BI dashboard?

A BI dashboard can display a wide range of data, including financial data, sales data, customer data, website traffic, social media engagement, and more. The data displayed in a dashboard depends on the organization's goals and objectives.

What tools are used for creating BI dashboards?

Our dashboarding service includes Microsoft Power BI and Tableau.

How can I ensure my BI dashboard provides a good return on investment?

To ensure a good return on investment, it's important to define clear goals and objectives for the dashboard, choose the right software and tools, and involve key stakeholders in the development and implementation process. It's also important to regularly review and update the dashboard to ensure it continues to provide value to the organization.

Have a Question?

Please feel free to reach out and our friendly team will be happy to help

Have a Question?