CONTENT
Meet Plan: Bringing Business Planning into Microsoft Fabric
Microsoft Fabric Plan brings planning, forecasting and scenario modelling closer to the data organizations already manage in Fabric. In this article, we explore how Plan works and share lessons from using it in a real project.


Kavi Samarathunga
Data & AI intern
Meet Plan: Bringing Business Planning into Microsoft Fabric
From spreadsheets to connected planning
Planning often sits in a world separate from analytics.
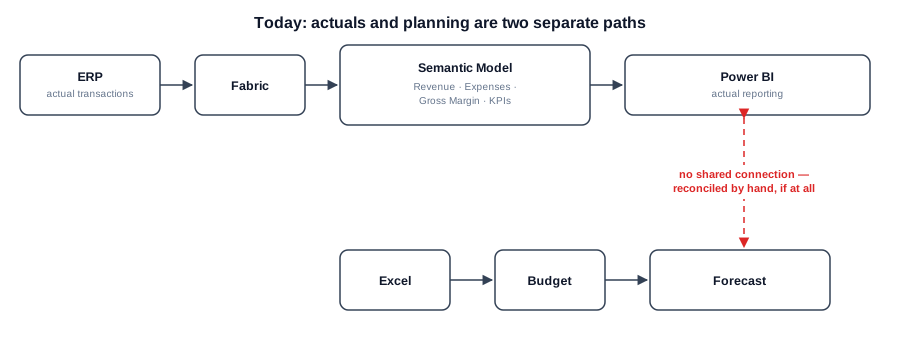
Organisations may have actual business data flowing through ERP, CRM, operational systems and Microsoft Fabric, with Power BI providing a trusted view of performance. But when it comes time to plan for the next quarter or financial year, the process can quickly move back into spreadsheets.
That separation creates familiar challenges: multiple workbook versions, manual reconciliation, inconsistent assumptions and a disconnect between the numbers being reported and the numbers being planned.
Microsoft Fabric Plan brings those activities closer together by introducing planning directly into the Fabric ecosystem.
And although budgeting is an obvious use case, Plan isn't only about Finance. The same approach can support sales forecasting, workforce planning, marketing investment, operational planning, demand planning and other scenarios where organisations need to model what could happen next.
What is Microsoft Fabric Plan?
Plan is Microsoft's enterprise planning capability within Fabric IQ.
It provides an environment for creating plans, forecasts and scenarios using business data and structures that can already exist within Microsoft Fabric.
The important distinction is that planning doesn't have to operate as an isolated process.
Instead of maintaining one set of business definitions for analytics and another inside spreadsheets, organisations can connect planning to the semantic models that already describe their business.
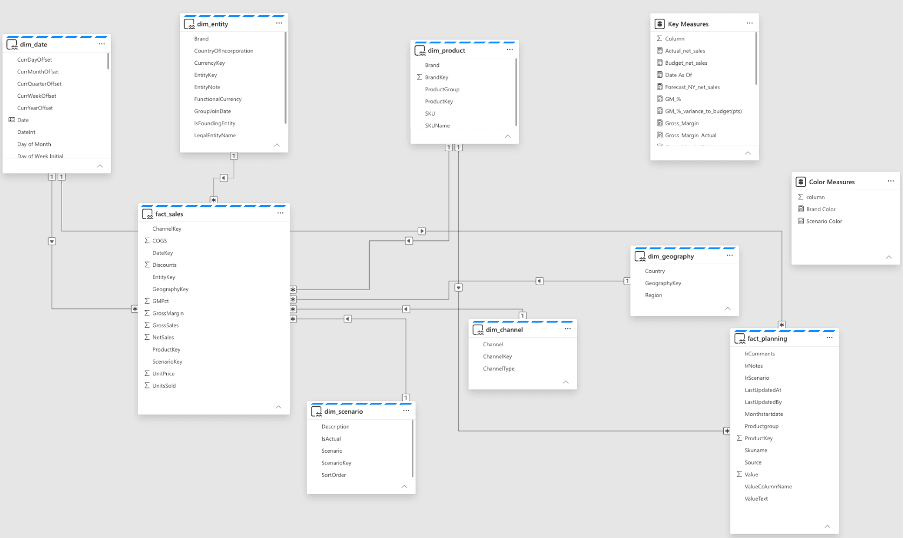
Now with the Plan the architecture becomes something closer to:
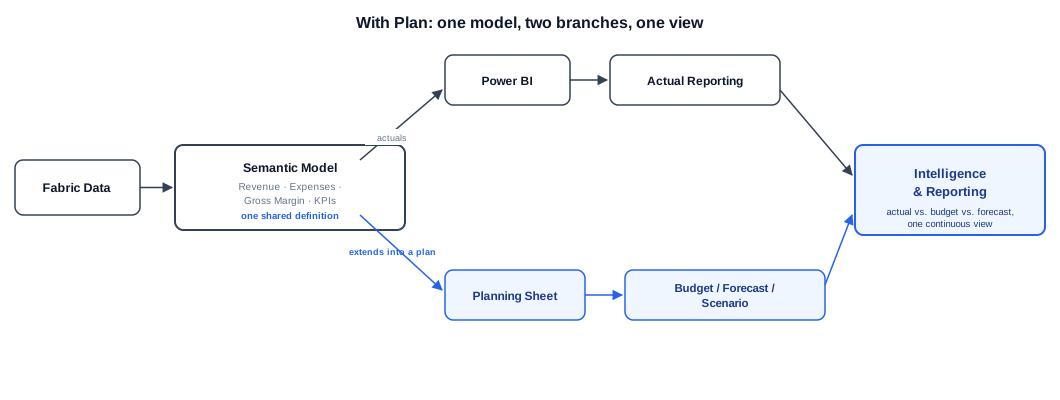
This means dimensions such as Product, Region, Department, Customer, Date or Business Unit can become part of the planning experience, alongside the measures organizations already use to understand performance.
Getting Started with Plan
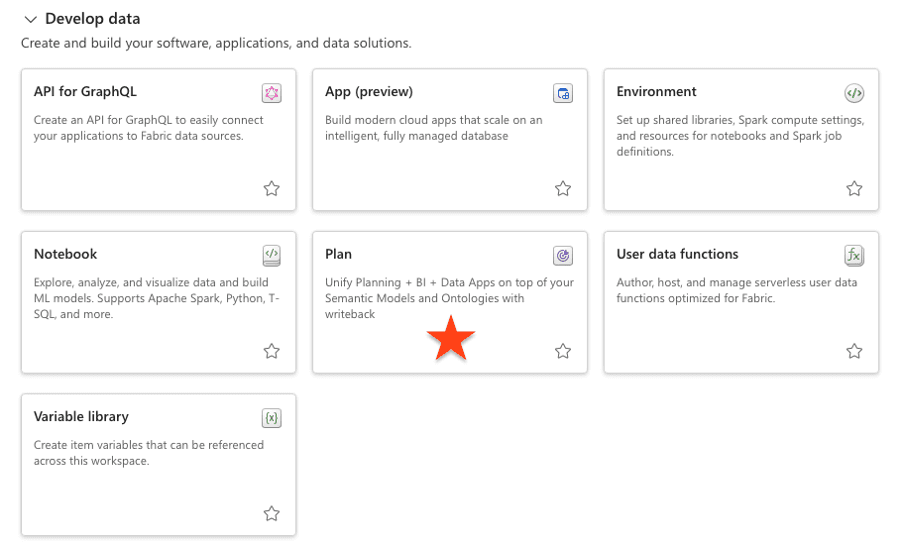
Plan can be created directly from a Microsoft Fabric workspace.
When creating a new Fabric item, Plan appears alongside other Fabric development and data capabilities. From there, the planning application can be configured around the organisation's requirements.
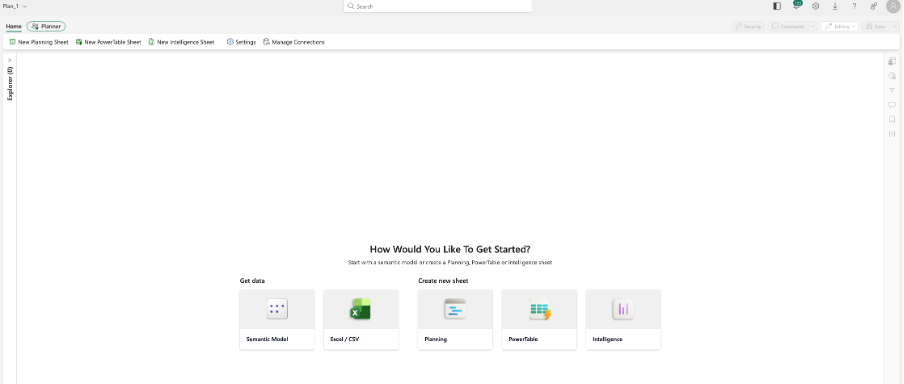
Once the Plan item has been created, the next step is deciding what the organisation actually wants to plan and connecting the relevant business data.
Connecting Planning to Business Data
A strong planning solution starts with the data model underneath it.
Suppose an organization already analyses performance using dimensions such as:
Product
Region
Customer
Department
Date
and measures such as:
Sales
Quantity
Margin
Headcount
Operating Cost
Those same structures can provide the business context for planning.
For example, instead of creating a completely separate sales-planning workbook containing another product hierarchy, Plan can work with the organization's existing business structure.
This is important because planning isn't only about entering numbers. The numbers need context.
A forecast of $1.5 million doesn't tell us much on its own.
We need to know:
Which period? Which product? Which region? Which scenario?
That dimensional structure is what turns a collection of entered values into a useful planning model.
Planning Sheets: Where the Planning Starts
Once the underlying business structure is in place, the Planning Sheet becomes the main working environment.
The interface is deliberately familiar. Business users can work with rows, columns, dimensions and values in a spreadsheet-style experience while remaining within the Fabric planning environment.
But there is an important difference between a Planning Sheet and simply opening another spreadsheet.
The sheet is connected to the wider planning model.
For example, your project starts with a baseline containing actual product sales information. The screenshot below shows products grouped into categories with the existing actual values providing the starting point for planning.
Establishing a planning baseline using existing business data in Fabric Plan.
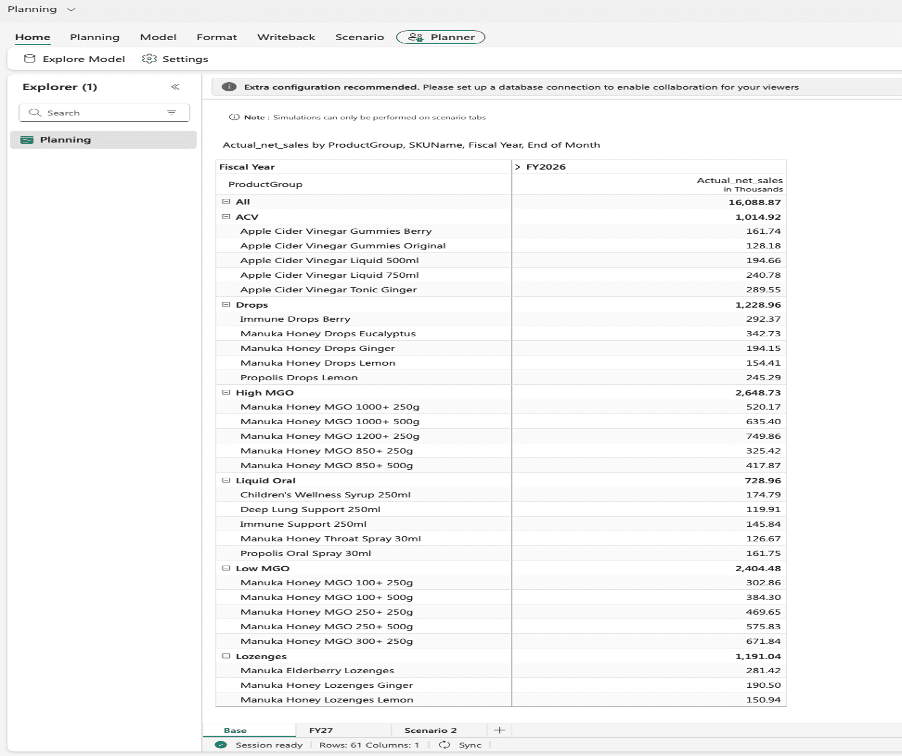
In this example, existing product-level information provides the baseline for the planning process. Rather than beginning with arbitrary values in an empty spreadsheet, planners can start from the business data already available to them.
From a Baseline to a Business Plan
Once a baseline has been established, users can begin turning that data into a forward-looking plan.
That might mean creating next year's sales forecast, developing a workforce plan, setting marketing targets or modelling future operational demand.
For example, a sales team could use historical product performance as its starting point and create an FY27 sales plan.
Rather than applying the same assumption everywhere, planners could adjust expectations at different levels of the business:
Product A: expected growth of 5%
Product B: expected growth of 12%
Region North: lower target based on expected market conditions
New product range: additional planned sales beginning in Q2
The same principle applies outside Sales.
A workforce planning team might adjust planned headcount by department.
A marketing team could model campaign investment by channel and period.
An operations team could adjust expected volumes or resource requirements.
The important point is that the planning process is driven by business assumptions rather than being limited to one particular business function.
Creating an FY27 forecast from the planning baseline.
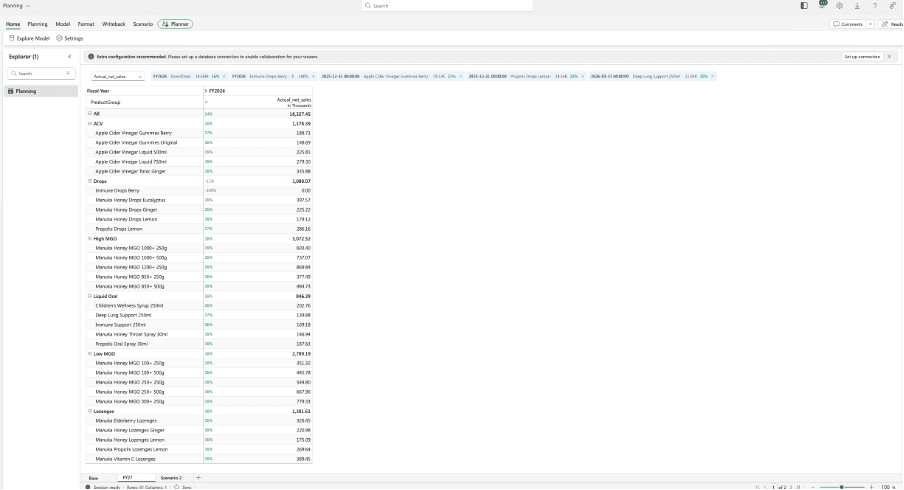
Here, the baseline has evolved into a forward-looking FY27 forecast. Users can adjust planning values while retaining the dimensional context of the underlying business data.
Exploring Different Scenarios
A single forecast rarely answers every business question.
Once an initial plan exists, teams inevitably start asking:
What happens if our assumptions change?
Perhaps expected product growth is lower than originally forecast.
Perhaps marketing investment increases.
Perhaps additional employees are required.
Perhaps demand grows faster than available operational capacity.
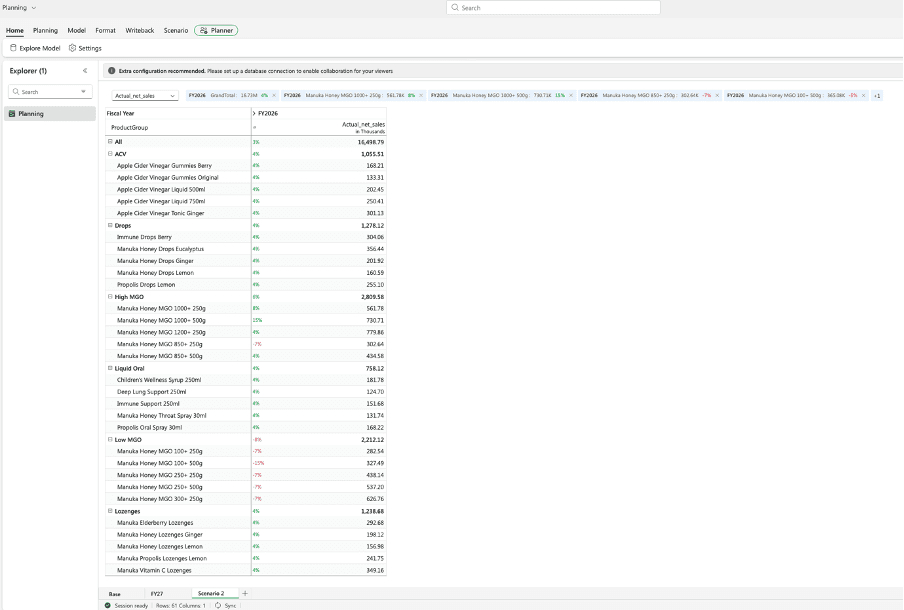
Instead of overwriting the original plan, different assumptions can be modelled through scenarios.
For example:
Scenario 1 — Current Plan
Expected sales growth: 8%
Scenario 2 — Growth Case
Expected sales growth: 12%
Scenario 3 — Conservative Case
Expected sales growth: 3%
Users can then compare the outcomes and understand how changing assumptions affects the wider plan.
This makes scenario planning useful beyond traditional budgeting. The same technique can help organisations compare sales strategies, workforce requirements, marketing investments, operational capacity or other future business decisions.
Creating an alternative planning scenario to test different business assumptions.
From Planning to Insight
Creating a plan isn't the end of the process.
Once scenarios have been developed, organisations need to understand how those plans compare with actual performance and with one another.
This is where the analytical side of Plan becomes important.
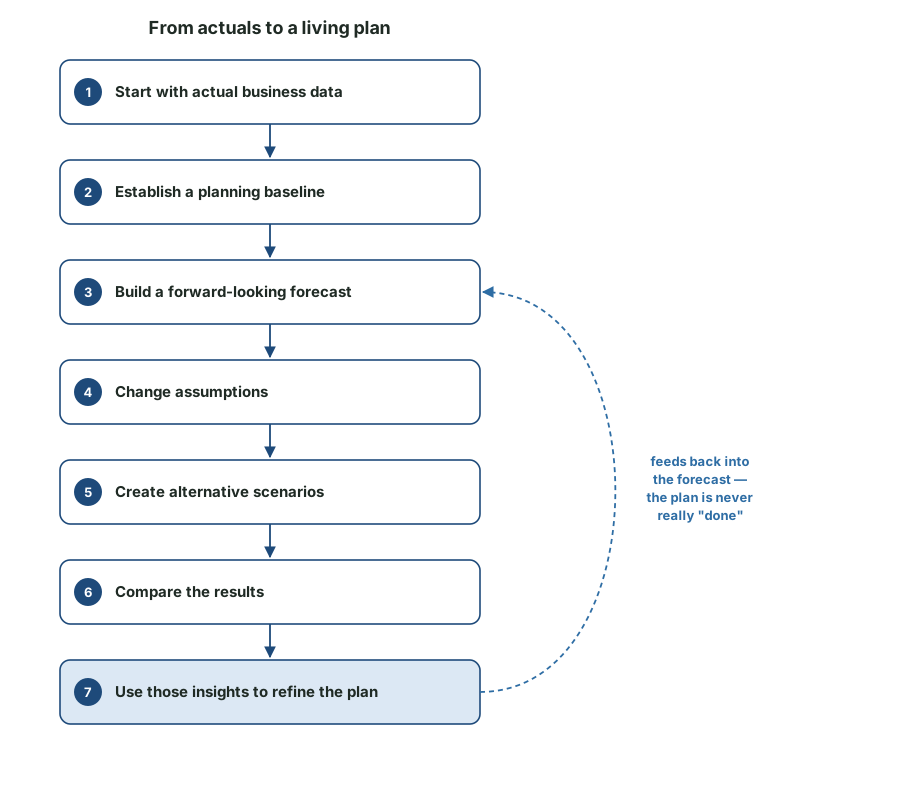
Instead of treating planning as a process that finishes when someone submits a spreadsheet, teams can move through a continuous cycle:
Plan → Measure → Compare → Understand → Adjust
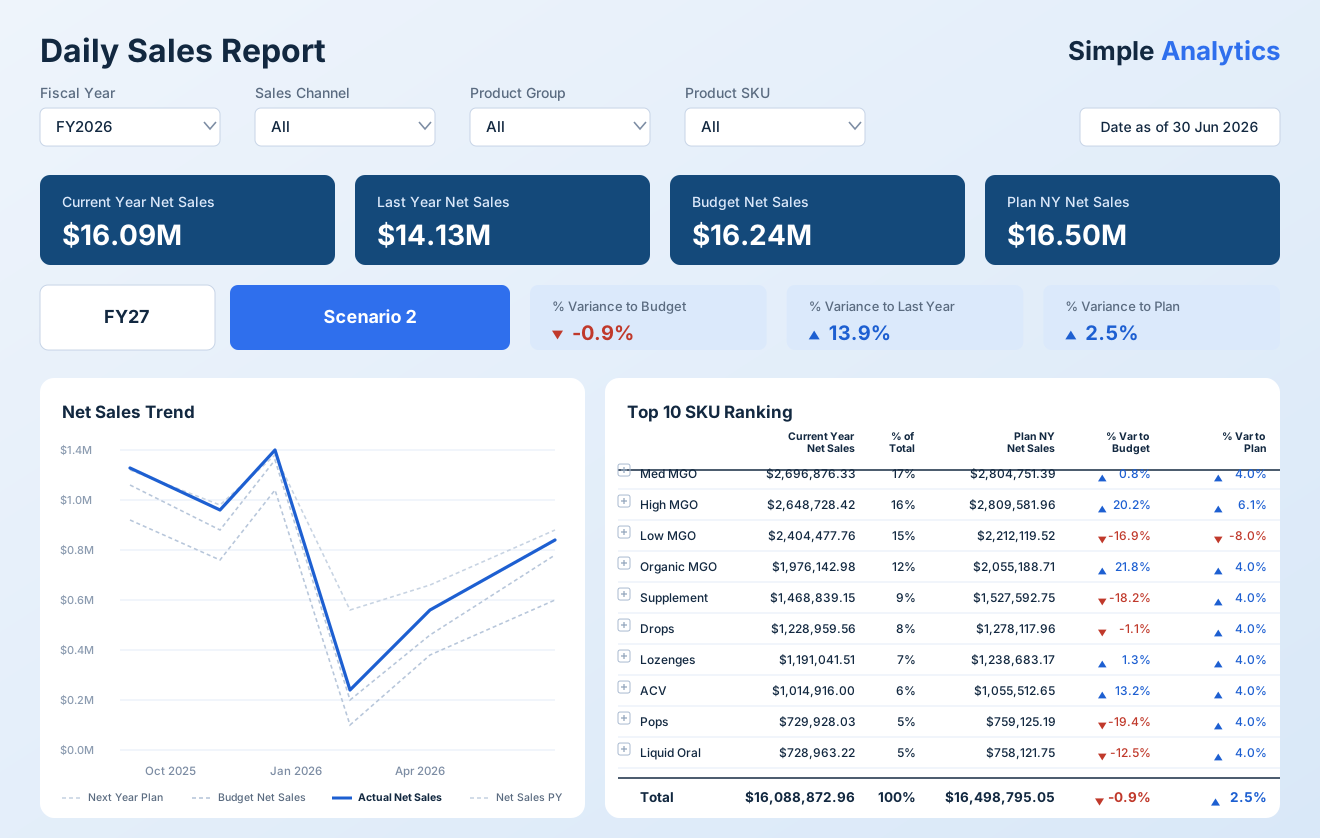
For example, a sales team could compare:
Current Sales
Last Year's Sales
Budget
Plan
and investigate where performance differs from expectations.
That could reveal that overall sales are close to plan while one product category or sales channel is significantly underperforming.
The planning conversation therefore moves from:
“What number should we enter?”
toward:
“Why are we different from plan, and should our assumptions change?”
Bringing actual, budget and planned performance together for variance analysis.
Beyond Simple Planning Grids
Planning models can quickly become multidimensional.
A relatively straightforward sales plan might need to account for:
Product × Region × Customer × Month × Scenario
A workforce model might instead involve:
Department × Role × Location × Month × Scenario
while marketing planning could involve:
Campaign × Channel × Region × Period × Scenario
As those requirements grow, Plan provides capabilities for working with larger and more structured planning datasets.
This is where PowerTable can become relevant.
For larger or more structured planning requirements, Power Table provides another component of the Plan experience.
What We Learned Using Plan on a Real Project
Start with the business model, not the screen
It's tempting to begin by designing a Planning Sheet because that's what users see.
But the quality of the planning experience depends heavily on the business structure underneath it.
Think about dimensions, relationships, granularity and the measures planners actually need before focusing on how the sheet should look.
Design for the person doing the planning
A technically sophisticated model isn't automatically a usable planning model.
Finance, Sales, Marketing, HR and operational teams may all think about planning differently.
The experience should reflect how those users actually make decisions.
Think carefully about dimensionality
Every additional planning dimension introduces flexibility, but also complexity.
Planning by:
Product × Customer × Region × Month × Scenario
is considerably different from simply planning by Product and Month.
Only introduce detail when there is a genuine planning requirement for it.
Clearly distinguish actuals from assumptions
Users should be able to understand which values originated from source systems and which values represent editable planning assumptions.
That distinction becomes especially important once multiple forecasts and scenarios exist.
Test the complete planning journey
Don't stop testing when someone successfully enters a value.
Test the entire flow:
Baseline → Plan → Update → Scenario → Analysis → Revised Plan
That's the actual planning experience.
Common Pitfalls
Recreating Excel inside Fabric
The spreadsheet-style experience is useful because it's familiar, but simply reproducing an existing workbook misses much of the value of Plan.
Building too much at once
Start with a clearly defined planning problem.
For example:
Create an FY27 product sales plan and allow the business to model alternative growth scenarios.
That is a much better starting point than:
Move all organisational planning into Fabric.
Designing around the technology rather than the decision
Always come back to the question:
What decision should this planning model help someone make?
That question should determine the dimensions, assumptions, scenarios and analysis you build.
The Bottom Line
Microsoft Fabric Plan is interesting not because it provides another spreadsheet-like interface, but because it brings forward-looking planning closer to the data and analytics organisations already manage in Microsoft Fabric.
And planning doesn't have to mean only financial budgeting.
The same pattern can be applied to sales targets, workforce requirements, marketing investment, operational capacity, demand forecasts and many other business decisions.
That moves Fabric beyond answering:
“What happened?”
toward:
“What could happen?”
and ultimately:
“What should we plan for?”
Meet Plan: Bringing Business Planning into Microsoft Fabric
From spreadsheets to connected planning
Planning often sits in a world separate from analytics.
Organisations may have actual business data flowing through ERP, CRM, operational systems and Microsoft Fabric, with Power BI providing a trusted view of performance. But when it comes time to plan for the next quarter or financial year, the process can quickly move back into spreadsheets.
That separation creates familiar challenges: multiple workbook versions, manual reconciliation, inconsistent assumptions and a disconnect between the numbers being reported and the numbers being planned.
Microsoft Fabric Plan brings those activities closer together by introducing planning directly into the Fabric ecosystem.
And although budgeting is an obvious use case, Plan isn't only about Finance. The same approach can support sales forecasting, workforce planning, marketing investment, operational planning, demand planning and other scenarios where organisations need to model what could happen next.
What is Microsoft Fabric Plan?
Plan is Microsoft's enterprise planning capability within Fabric IQ.
It provides an environment for creating plans, forecasts and scenarios using business data and structures that can already exist within Microsoft Fabric.
The important distinction is that planning doesn't have to operate as an isolated process.
Instead of maintaining one set of business definitions for analytics and another inside spreadsheets, organisations can connect planning to the semantic models that already describe their business.
Now with the Plan the architecture becomes something closer to:
This means dimensions such as Product, Region, Department, Customer, Date or Business Unit can become part of the planning experience, alongside the measures organizations already use to understand performance.
Getting Started with Plan
Plan can be created directly from a Microsoft Fabric workspace.
When creating a new Fabric item, Plan appears alongside other Fabric development and data capabilities. From there, the planning application can be configured around the organisation's requirements.
Once the Plan item has been created, the next step is deciding what the organisation actually wants to plan and connecting the relevant business data.
Connecting Planning to Business Data
A strong planning solution starts with the data model underneath it.
Suppose an organization already analyses performance using dimensions such as:
Product
Region
Customer
Department
Date
and measures such as:
Sales
Quantity
Margin
Headcount
Operating Cost
Those same structures can provide the business context for planning.
For example, instead of creating a completely separate sales-planning workbook containing another product hierarchy, Plan can work with the organization's existing business structure.
This is important because planning isn't only about entering numbers. The numbers need context.
A forecast of $1.5 million doesn't tell us much on its own.
We need to know:
Which period? Which product? Which region? Which scenario?
That dimensional structure is what turns a collection of entered values into a useful planning model.
Planning Sheets: Where the Planning Starts
Once the underlying business structure is in place, the Planning Sheet becomes the main working environment.
The interface is deliberately familiar. Business users can work with rows, columns, dimensions and values in a spreadsheet-style experience while remaining within the Fabric planning environment.
But there is an important difference between a Planning Sheet and simply opening another spreadsheet.
The sheet is connected to the wider planning model.
For example, your project starts with a baseline containing actual product sales information. The screenshot below shows products grouped into categories with the existing actual values providing the starting point for planning.
Establishing a planning baseline using existing business data in Fabric Plan.
In this example, existing product-level information provides the baseline for the planning process. Rather than beginning with arbitrary values in an empty spreadsheet, planners can start from the business data already available to them.
From a Baseline to a Business Plan
Once a baseline has been established, users can begin turning that data into a forward-looking plan.
That might mean creating next year's sales forecast, developing a workforce plan, setting marketing targets or modelling future operational demand.
For example, a sales team could use historical product performance as its starting point and create an FY27 sales plan.
Rather than applying the same assumption everywhere, planners could adjust expectations at different levels of the business:
Product A: expected growth of 5%
Product B: expected growth of 12%
Region North: lower target based on expected market conditions
New product range: additional planned sales beginning in Q2
The same principle applies outside Sales.
A workforce planning team might adjust planned headcount by department.
A marketing team could model campaign investment by channel and period.
An operations team could adjust expected volumes or resource requirements.
The important point is that the planning process is driven by business assumptions rather than being limited to one particular business function.
Creating an FY27 forecast from the planning baseline.
Here, the baseline has evolved into a forward-looking FY27 forecast. Users can adjust planning values while retaining the dimensional context of the underlying business data.
Exploring Different Scenarios
A single forecast rarely answers every business question.
Once an initial plan exists, teams inevitably start asking:
What happens if our assumptions change?
Perhaps expected product growth is lower than originally forecast.
Perhaps marketing investment increases.
Perhaps additional employees are required.
Perhaps demand grows faster than available operational capacity.
Instead of overwriting the original plan, different assumptions can be modelled through scenarios.
For example:
Scenario 1 — Current Plan
Expected sales growth: 8%
Scenario 2 — Growth Case
Expected sales growth: 12%
Scenario 3 — Conservative Case
Expected sales growth: 3%
Users can then compare the outcomes and understand how changing assumptions affects the wider plan.
This makes scenario planning useful beyond traditional budgeting. The same technique can help organisations compare sales strategies, workforce requirements, marketing investments, operational capacity or other future business decisions.
Creating an alternative planning scenario to test different business assumptions.
From Planning to Insight
Creating a plan isn't the end of the process.
Once scenarios have been developed, organisations need to understand how those plans compare with actual performance and with one another.
This is where the analytical side of Plan becomes important.
Instead of treating planning as a process that finishes when someone submits a spreadsheet, teams can move through a continuous cycle:
Plan → Measure → Compare → Understand → Adjust
For example, a sales team could compare:
Current Sales
Last Year's Sales
Budget
Plan
and investigate where performance differs from expectations.
That could reveal that overall sales are close to plan while one product category or sales channel is significantly underperforming.
The planning conversation therefore moves from:
“What number should we enter?”
toward:
“Why are we different from plan, and should our assumptions change?”
Bringing actual, budget and planned performance together for variance analysis.
Beyond Simple Planning Grids
Planning models can quickly become multidimensional.
A relatively straightforward sales plan might need to account for:
Product × Region × Customer × Month × Scenario
A workforce model might instead involve:
Department × Role × Location × Month × Scenario
while marketing planning could involve:
Campaign × Channel × Region × Period × Scenario
As those requirements grow, Plan provides capabilities for working with larger and more structured planning datasets.
This is where PowerTable can become relevant.
For larger or more structured planning requirements, Power Table provides another component of the Plan experience.
What We Learned Using Plan on a Real Project
Start with the business model, not the screen
It's tempting to begin by designing a Planning Sheet because that's what users see.
But the quality of the planning experience depends heavily on the business structure underneath it.
Think about dimensions, relationships, granularity and the measures planners actually need before focusing on how the sheet should look.
Design for the person doing the planning
A technically sophisticated model isn't automatically a usable planning model.
Finance, Sales, Marketing, HR and operational teams may all think about planning differently.
The experience should reflect how those users actually make decisions.
Think carefully about dimensionality
Every additional planning dimension introduces flexibility, but also complexity.
Planning by:
Product × Customer × Region × Month × Scenario
is considerably different from simply planning by Product and Month.
Only introduce detail when there is a genuine planning requirement for it.
Clearly distinguish actuals from assumptions
Users should be able to understand which values originated from source systems and which values represent editable planning assumptions.
That distinction becomes especially important once multiple forecasts and scenarios exist.
Test the complete planning journey
Don't stop testing when someone successfully enters a value.
Test the entire flow:
Baseline → Plan → Update → Scenario → Analysis → Revised Plan
That's the actual planning experience.
Common Pitfalls
Recreating Excel inside Fabric
The spreadsheet-style experience is useful because it's familiar, but simply reproducing an existing workbook misses much of the value of Plan.
Building too much at once
Start with a clearly defined planning problem.
For example:
Create an FY27 product sales plan and allow the business to model alternative growth scenarios.
That is a much better starting point than:
Move all organisational planning into Fabric.
Designing around the technology rather than the decision
Always come back to the question:
What decision should this planning model help someone make?
That question should determine the dimensions, assumptions, scenarios and analysis you build.
The Bottom Line
Microsoft Fabric Plan is interesting not because it provides another spreadsheet-like interface, but because it brings forward-looking planning closer to the data and analytics organisations already manage in Microsoft Fabric.
And planning doesn't have to mean only financial budgeting.
The same pattern can be applied to sales targets, workforce requirements, marketing investment, operational capacity, demand forecasts and many other business decisions.
That moves Fabric beyond answering:
“What happened?”
toward:
“What could happen?”
and ultimately:
“What should we plan for?”
CONTENT
SHARE